Fig. D.1
Download original image
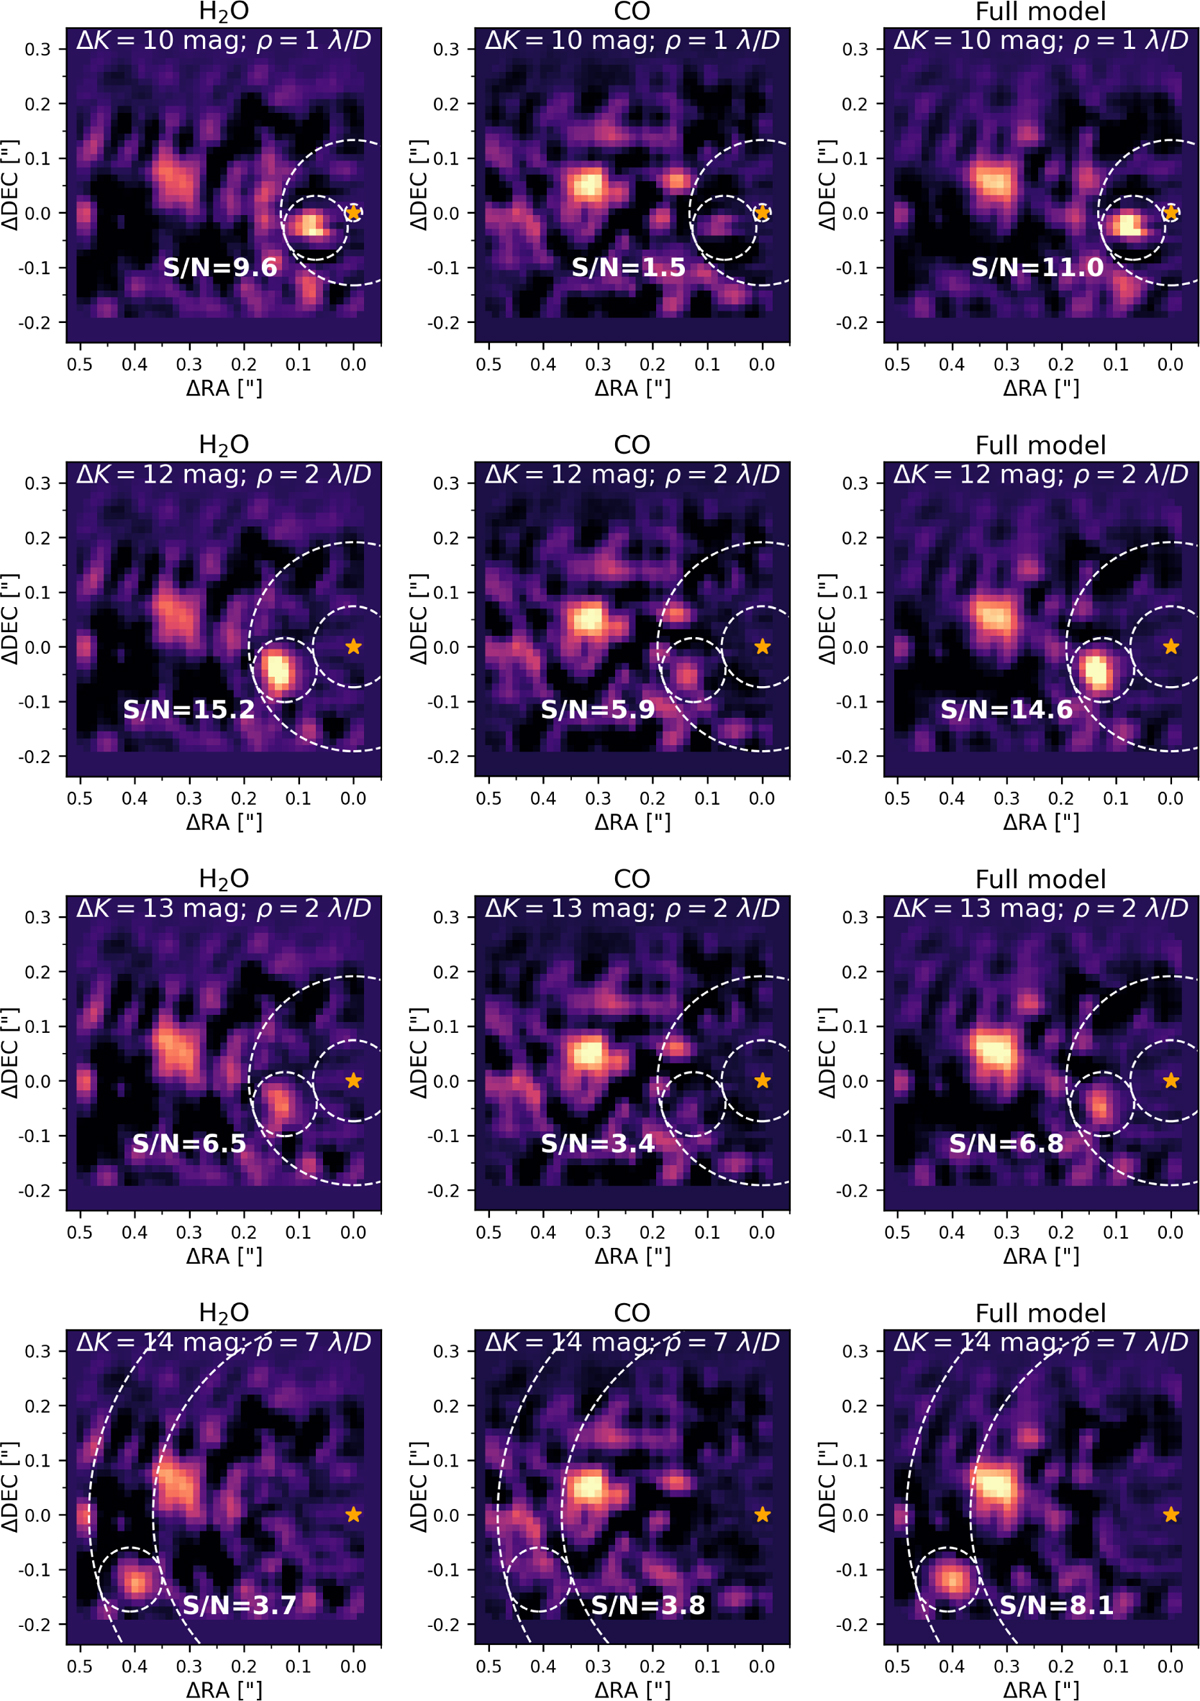
Sample of fake planet injection tests to support the detection limits extracted from the contrast grids computed in Sect. 4.4. Each row shows a different experiment, and each column shows the corresponding molecular map computed with a different spectral template. The contrast and angular separation of the injected planets are annotated in white at the top of each figure. The dotted white circles show the position of the injected planets as well as the annulus considered to compute the S/N. The molecular maps show the cross-correlation values at the RV of the injected planet, i.e. 0 km s−1, which is why they look slightly different than Fig. 3. The actual planet, AF Lep b, is still clearly visible due to the broad peak of the CCF (cf. Fig. 5).
Current usage metrics show cumulative count of Article Views (full-text article views including HTML views, PDF and ePub downloads, according to the available data) and Abstracts Views on Vision4Press platform.
Data correspond to usage on the plateform after 2015. The current usage metrics is available 48-96 hours after online publication and is updated daily on week days.
Initial download of the metrics may take a while.