Fig. C.1
Download original image
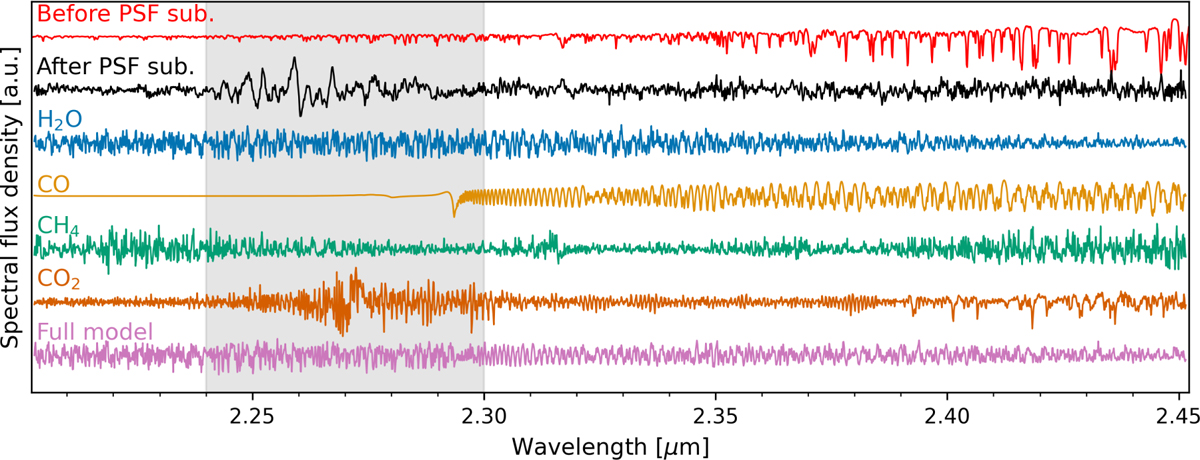
Spaxel at the position of the planet before and after PSF subtraction with spectral PCA and aperture convolution (red and black), and spectral templates used to compute the molecular maps presented in Fig. 3. All spectra are shown after continuum subtraction. Additionally, they are normalised and offset vertically for readability. The shaded area between 2.24 μm and 2.3 μm represents the masked wavelength range where stray light is present.
Current usage metrics show cumulative count of Article Views (full-text article views including HTML views, PDF and ePub downloads, according to the available data) and Abstracts Views on Vision4Press platform.
Data correspond to usage on the plateform after 2015. The current usage metrics is available 48-96 hours after online publication and is updated daily on week days.
Initial download of the metrics may take a while.