Fig. B.1
Download original image
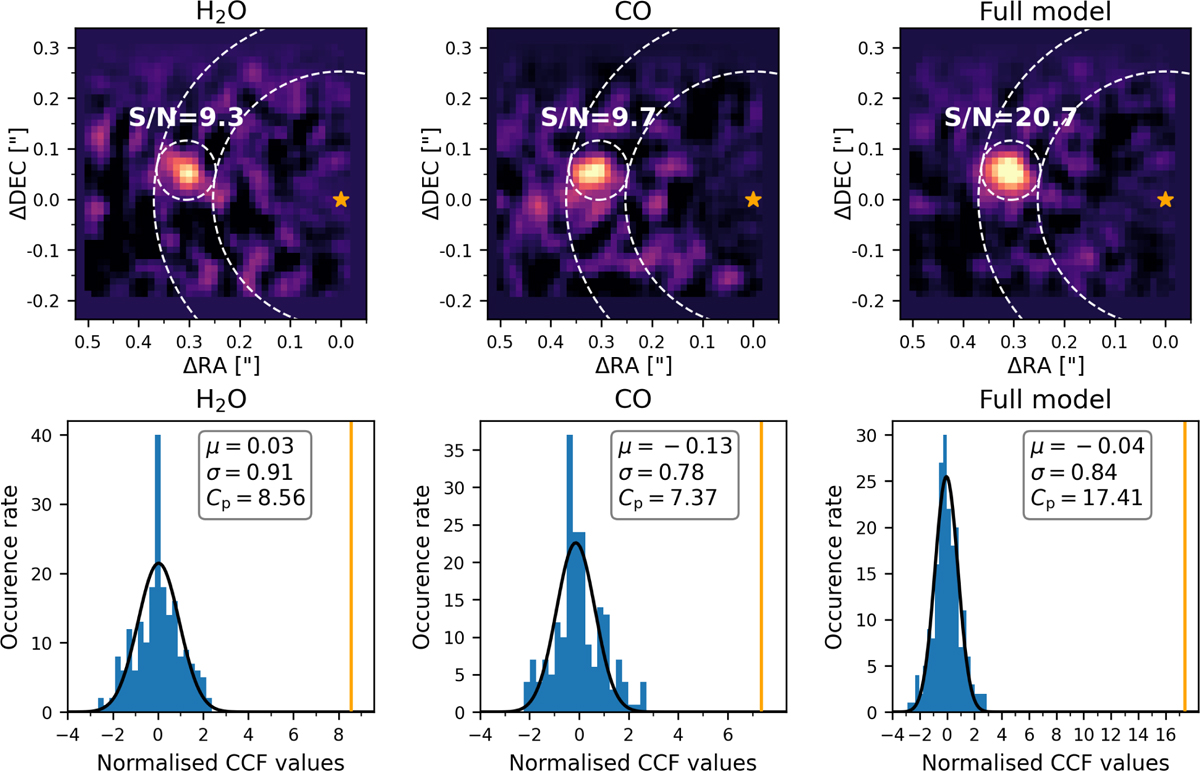
Top: molecular maps of H2O, CO, and full model. The dashed annulus highlights the region considered to quantify the S/N of the detection. The dashed circle represents the position of AF Lep b and is masked for the purpose of quantifying the S/N. Bottom: histograms of the values of the CCF contained in the annular region. The dark line shows the Gaussian fit (with parameters μ and σ shown in the legend), while the orange line shows the value Cp of the CCF at the position of the planet.
Current usage metrics show cumulative count of Article Views (full-text article views including HTML views, PDF and ePub downloads, according to the available data) and Abstracts Views on Vision4Press platform.
Data correspond to usage on the plateform after 2015. The current usage metrics is available 48-96 hours after online publication and is updated daily on week days.
Initial download of the metrics may take a while.