Fig. 1
Download original image
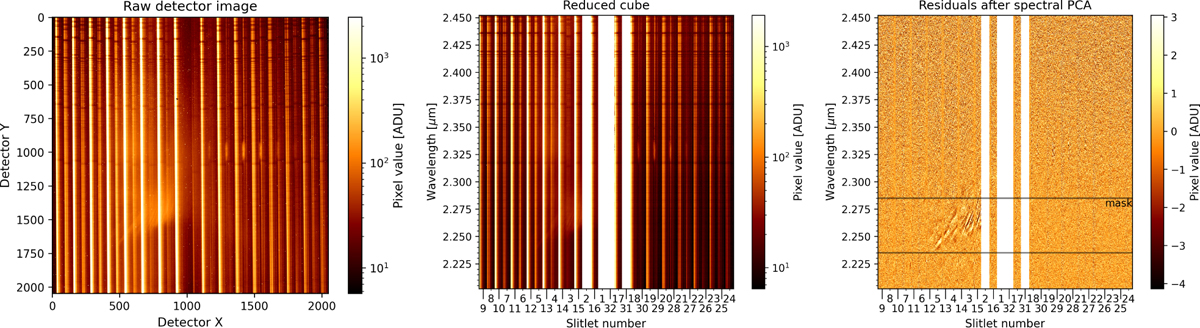
Illustration of the main processing steps applied to one frame of our dataset. Left: raw detector frame. The brick-wall pattern of the slitlets is visible as the telluric absorption lines are shifted in adjacent slitlets. Middle: reduced frame. The missing data in the middle is due to cropping the frames, essentially removing slitlets at the border of the image. Right: residuals after PSF subtraction via spectral PCA. The two horizontal lines at 2.24 and 2.30 μm mark the position of the mask applied to the data to hide the strong stray light features present in slitlets 2 to 6 and 12 to 15 (cf. Fig. C.1). The slitlets are numbered from 1 to 32, and span the image from bottom to top (i.e. from south to north).
Current usage metrics show cumulative count of Article Views (full-text article views including HTML views, PDF and ePub downloads, according to the available data) and Abstracts Views on Vision4Press platform.
Data correspond to usage on the plateform after 2015. The current usage metrics is available 48-96 hours after online publication and is updated daily on week days.
Initial download of the metrics may take a while.