Open Access
Fig. A.1.
Download original image
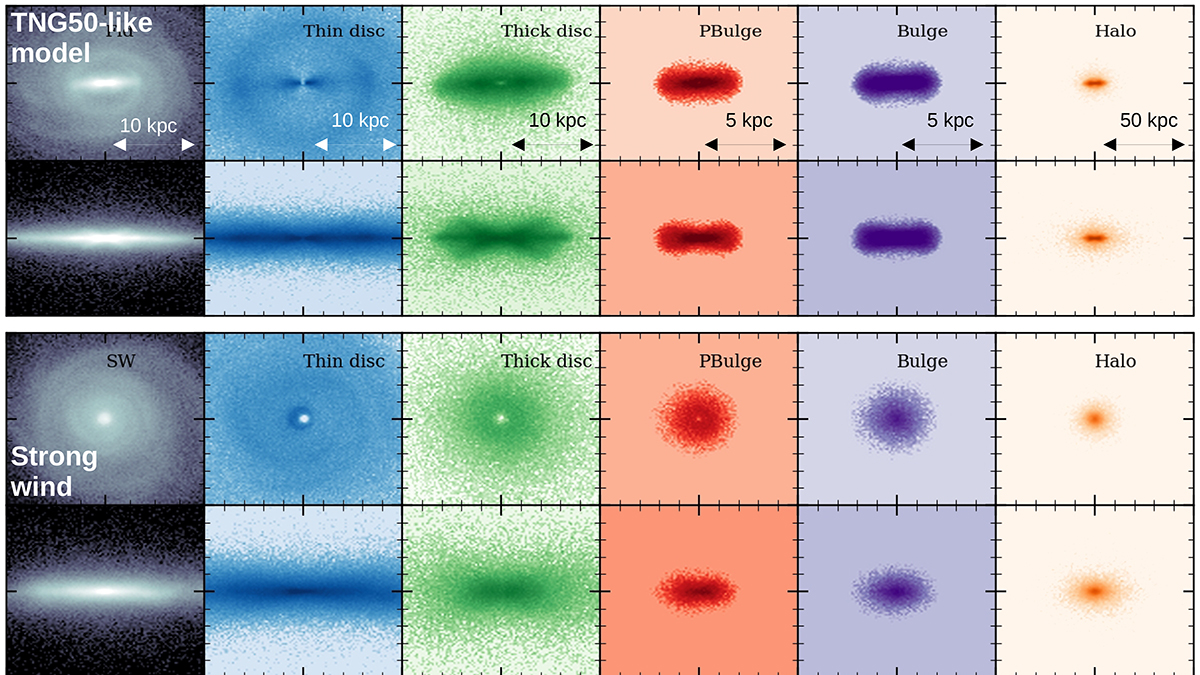
Stellar density maps of the galaxy components identified by MORDOR. From left to right, the columns show the total galaxy, thin disc, thick disc, pseudobulge, bulge, and halo. Top panels correspond to a galaxy in the TNG50-like model. The bottom panels correspond to the same galaxy in the strong wind model.
Current usage metrics show cumulative count of Article Views (full-text article views including HTML views, PDF and ePub downloads, according to the available data) and Abstracts Views on Vision4Press platform.
Data correspond to usage on the plateform after 2015. The current usage metrics is available 48-96 hours after online publication and is updated daily on week days.
Initial download of the metrics may take a while.