Open Access
Fig. 9.
Download original image
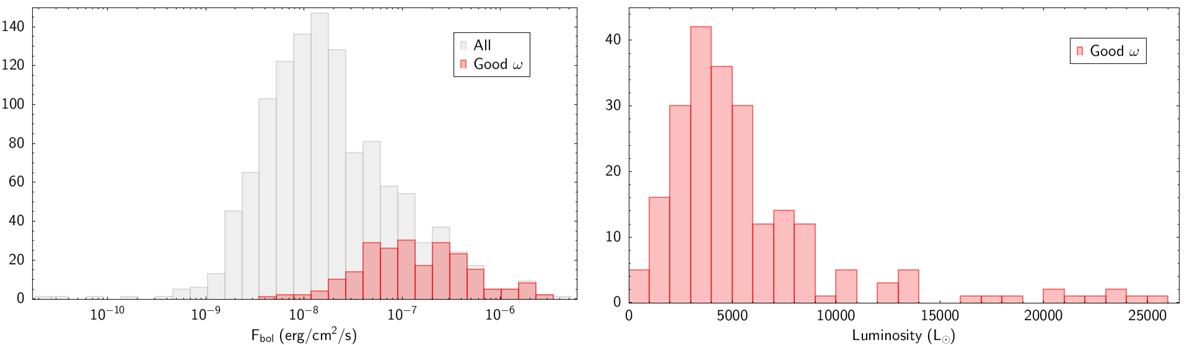
Left panel: Distribution of bolometric fluxes (left) of the Gaia OH/IR sample. The grey and red histograms correspond to the whole sample and to stars with good parallaxes (good ω), respectively. Right panel: Luminosity distribution for the subsample with good parallaxes.
Current usage metrics show cumulative count of Article Views (full-text article views including HTML views, PDF and ePub downloads, according to the available data) and Abstracts Views on Vision4Press platform.
Data correspond to usage on the plateform after 2015. The current usage metrics is available 48-96 hours after online publication and is updated daily on week days.
Initial download of the metrics may take a while.