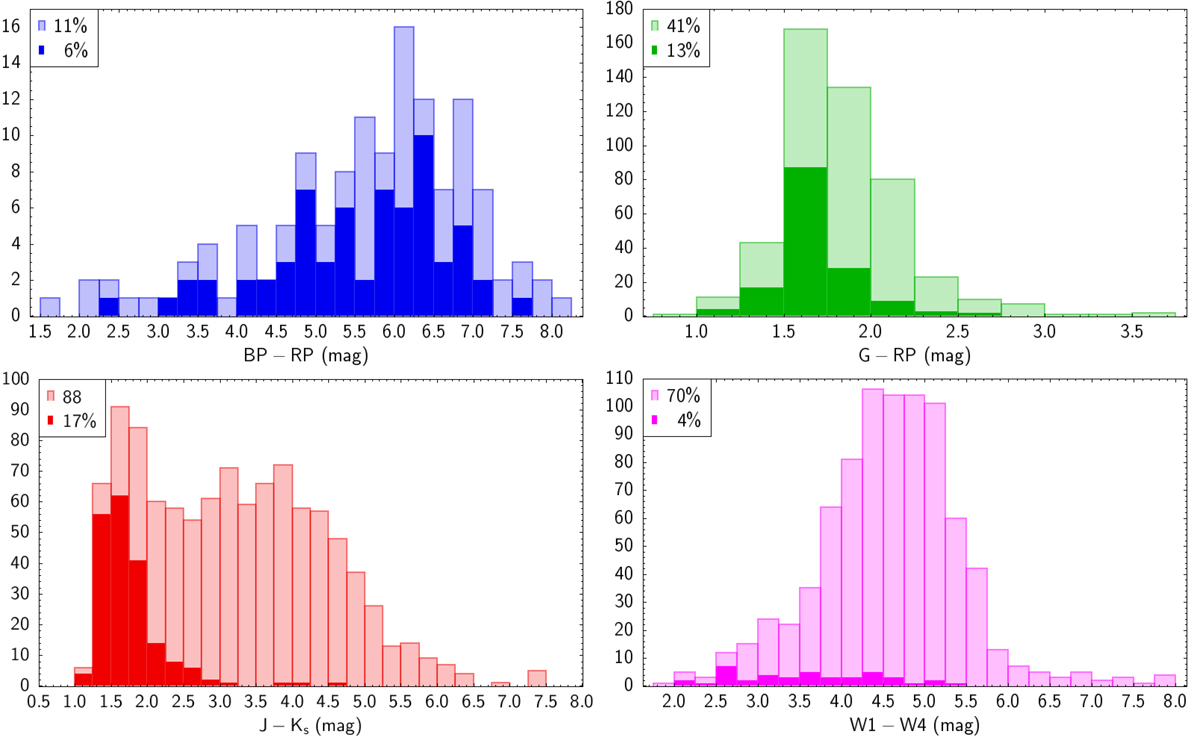
Fig. 8.
Download original image
Colour distributions of of the Gaia OH/IR sample (semi-filled histograms) and of the subsample of sources with a good astrometry (filled histograms). From left to right and from top to bottom: Gaia BP–RP and G–RP, 2MASS J − Ks, and WISE W1–W4 colours. The percentages refer to the fraction of sources with respect to the total Gaia OH/IR sample of 1172 sources.
Current usage metrics show cumulative count of Article Views (full-text article views including HTML views, PDF and ePub downloads, according to the available data) and Abstracts Views on Vision4Press platform.
Data correspond to usage on the plateform after 2015. The current usage metrics is available 48-96 hours after online publication and is updated daily on week days.
Initial download of the metrics may take a while.