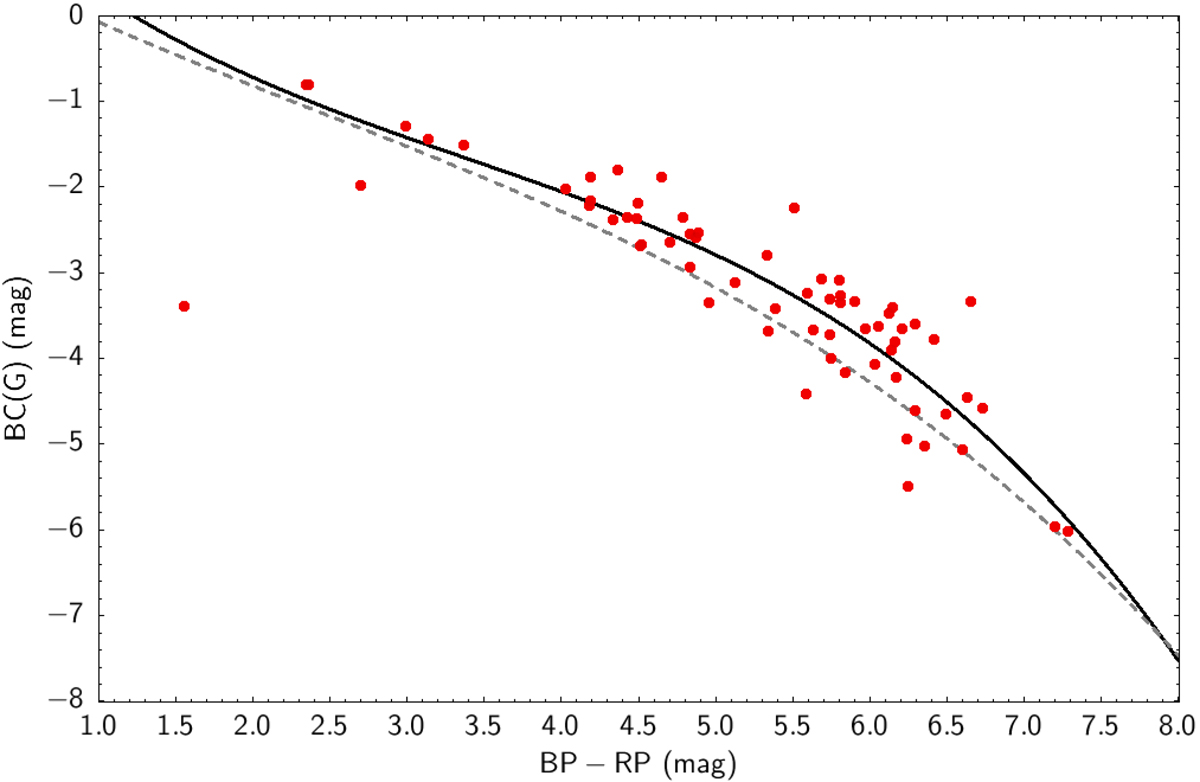
Fig. 11.
Download original image
Bolometric corrections BC(G) = Mbol − Gabs for the subsample of sources from the Gaia OH/IR stars with good parallaxes. The outlier in the diagram is IRAS 18319-1001, as discussed in the text. The solid curve shows the fit to the data as given in Sect. 5.4, and the broken curve is the bolometric correction as a function of BP–RP colour proposed by Lebzelter et al. (2019) without interstellar extinction.
Current usage metrics show cumulative count of Article Views (full-text article views including HTML views, PDF and ePub downloads, according to the available data) and Abstracts Views on Vision4Press platform.
Data correspond to usage on the plateform after 2015. The current usage metrics is available 48-96 hours after online publication and is updated daily on week days.
Initial download of the metrics may take a while.