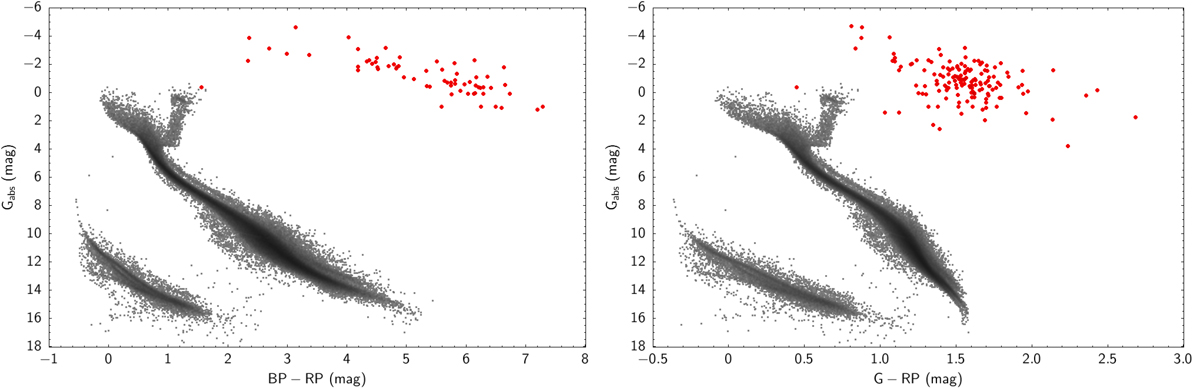
Fig. 10.
Download original image
Gaia DR3 HR diagrams using the extinction-corrected BP–RP and G–RP colours (left and right panel, respectively) for the subsample of sources with good parallaxes (red circles), compared to the location of the 100 pc stellar population (in grey). In each diagram, only sources with good photometry according to the criteria outlined in Sect. 5.2 are displayed.
Current usage metrics show cumulative count of Article Views (full-text article views including HTML views, PDF and ePub downloads, according to the available data) and Abstracts Views on Vision4Press platform.
Data correspond to usage on the plateform after 2015. The current usage metrics is available 48-96 hours after online publication and is updated daily on week days.
Initial download of the metrics may take a while.