Fig. B.2
Download original image
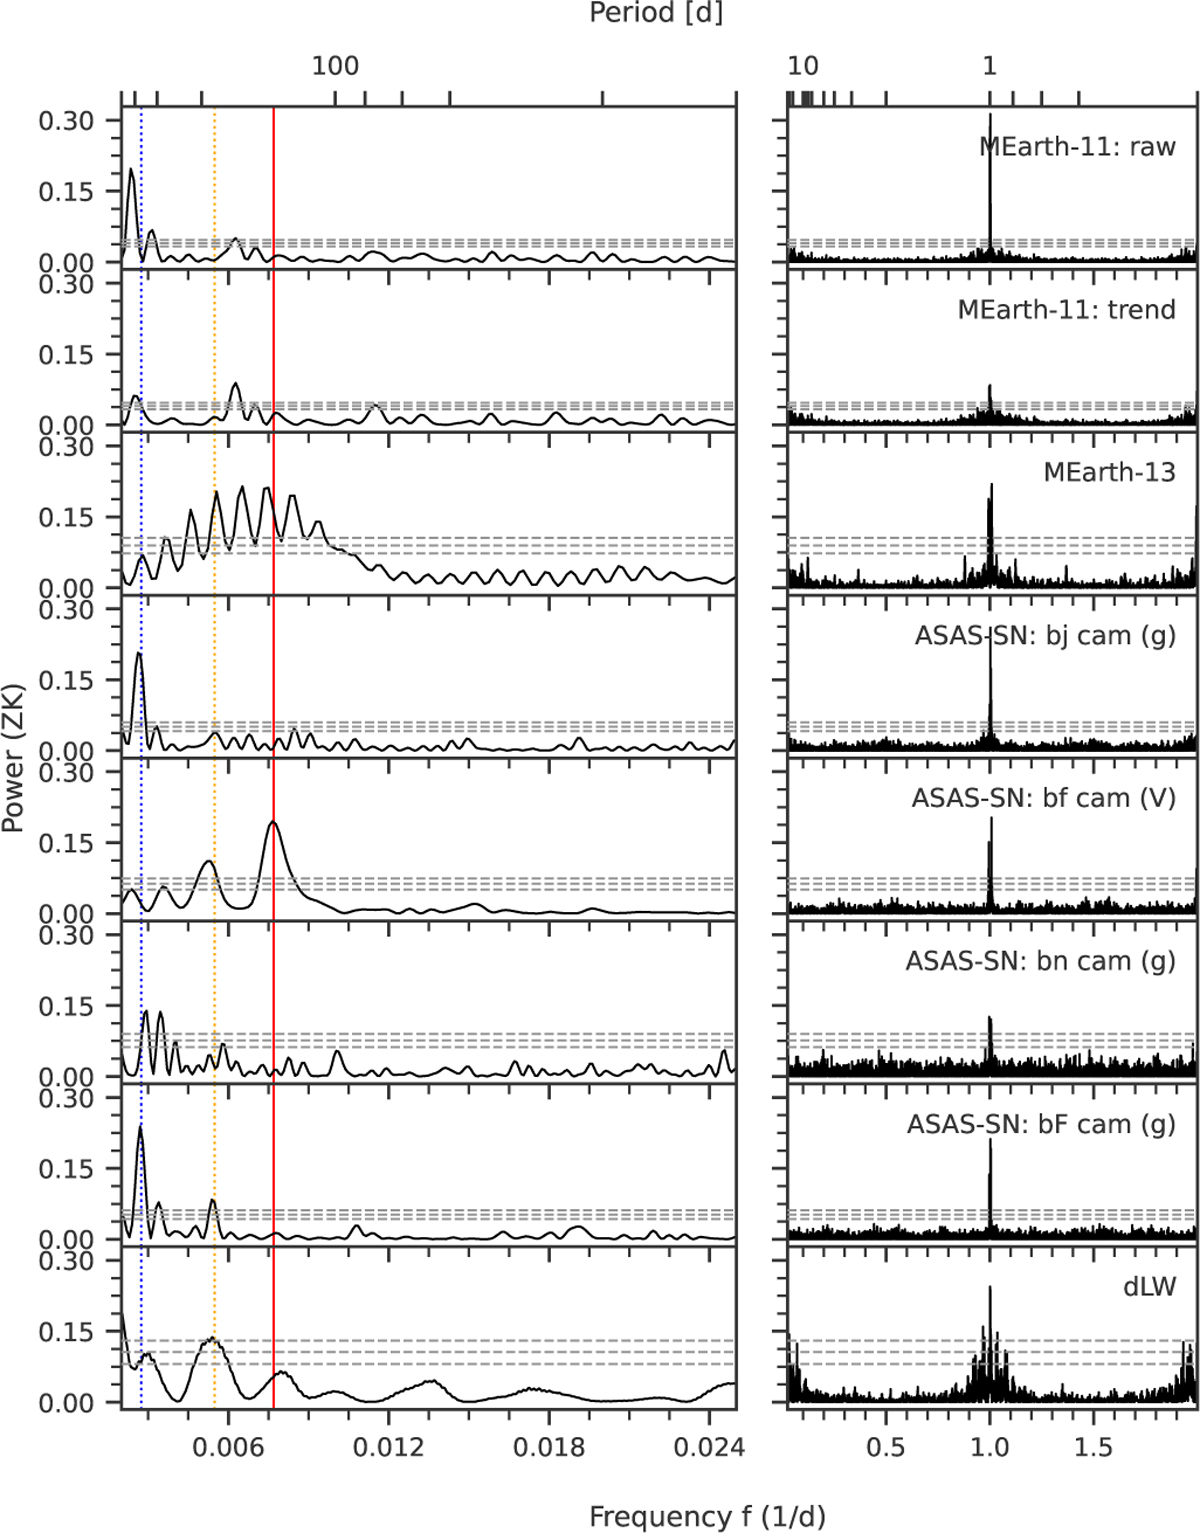
Left: GLS periodograms of photometric time series and the spectroscopic activity indicator differential line width (dLW). Other activity indicators do not show significant signals. The blue and yellow line mark the year and half year period. The red line indicates the potential rotation period at 125 d. Right: the window function of the time series.
Current usage metrics show cumulative count of Article Views (full-text article views including HTML views, PDF and ePub downloads, according to the available data) and Abstracts Views on Vision4Press platform.
Data correspond to usage on the plateform after 2015. The current usage metrics is available 48-96 hours after online publication and is updated daily on week days.
Initial download of the metrics may take a while.