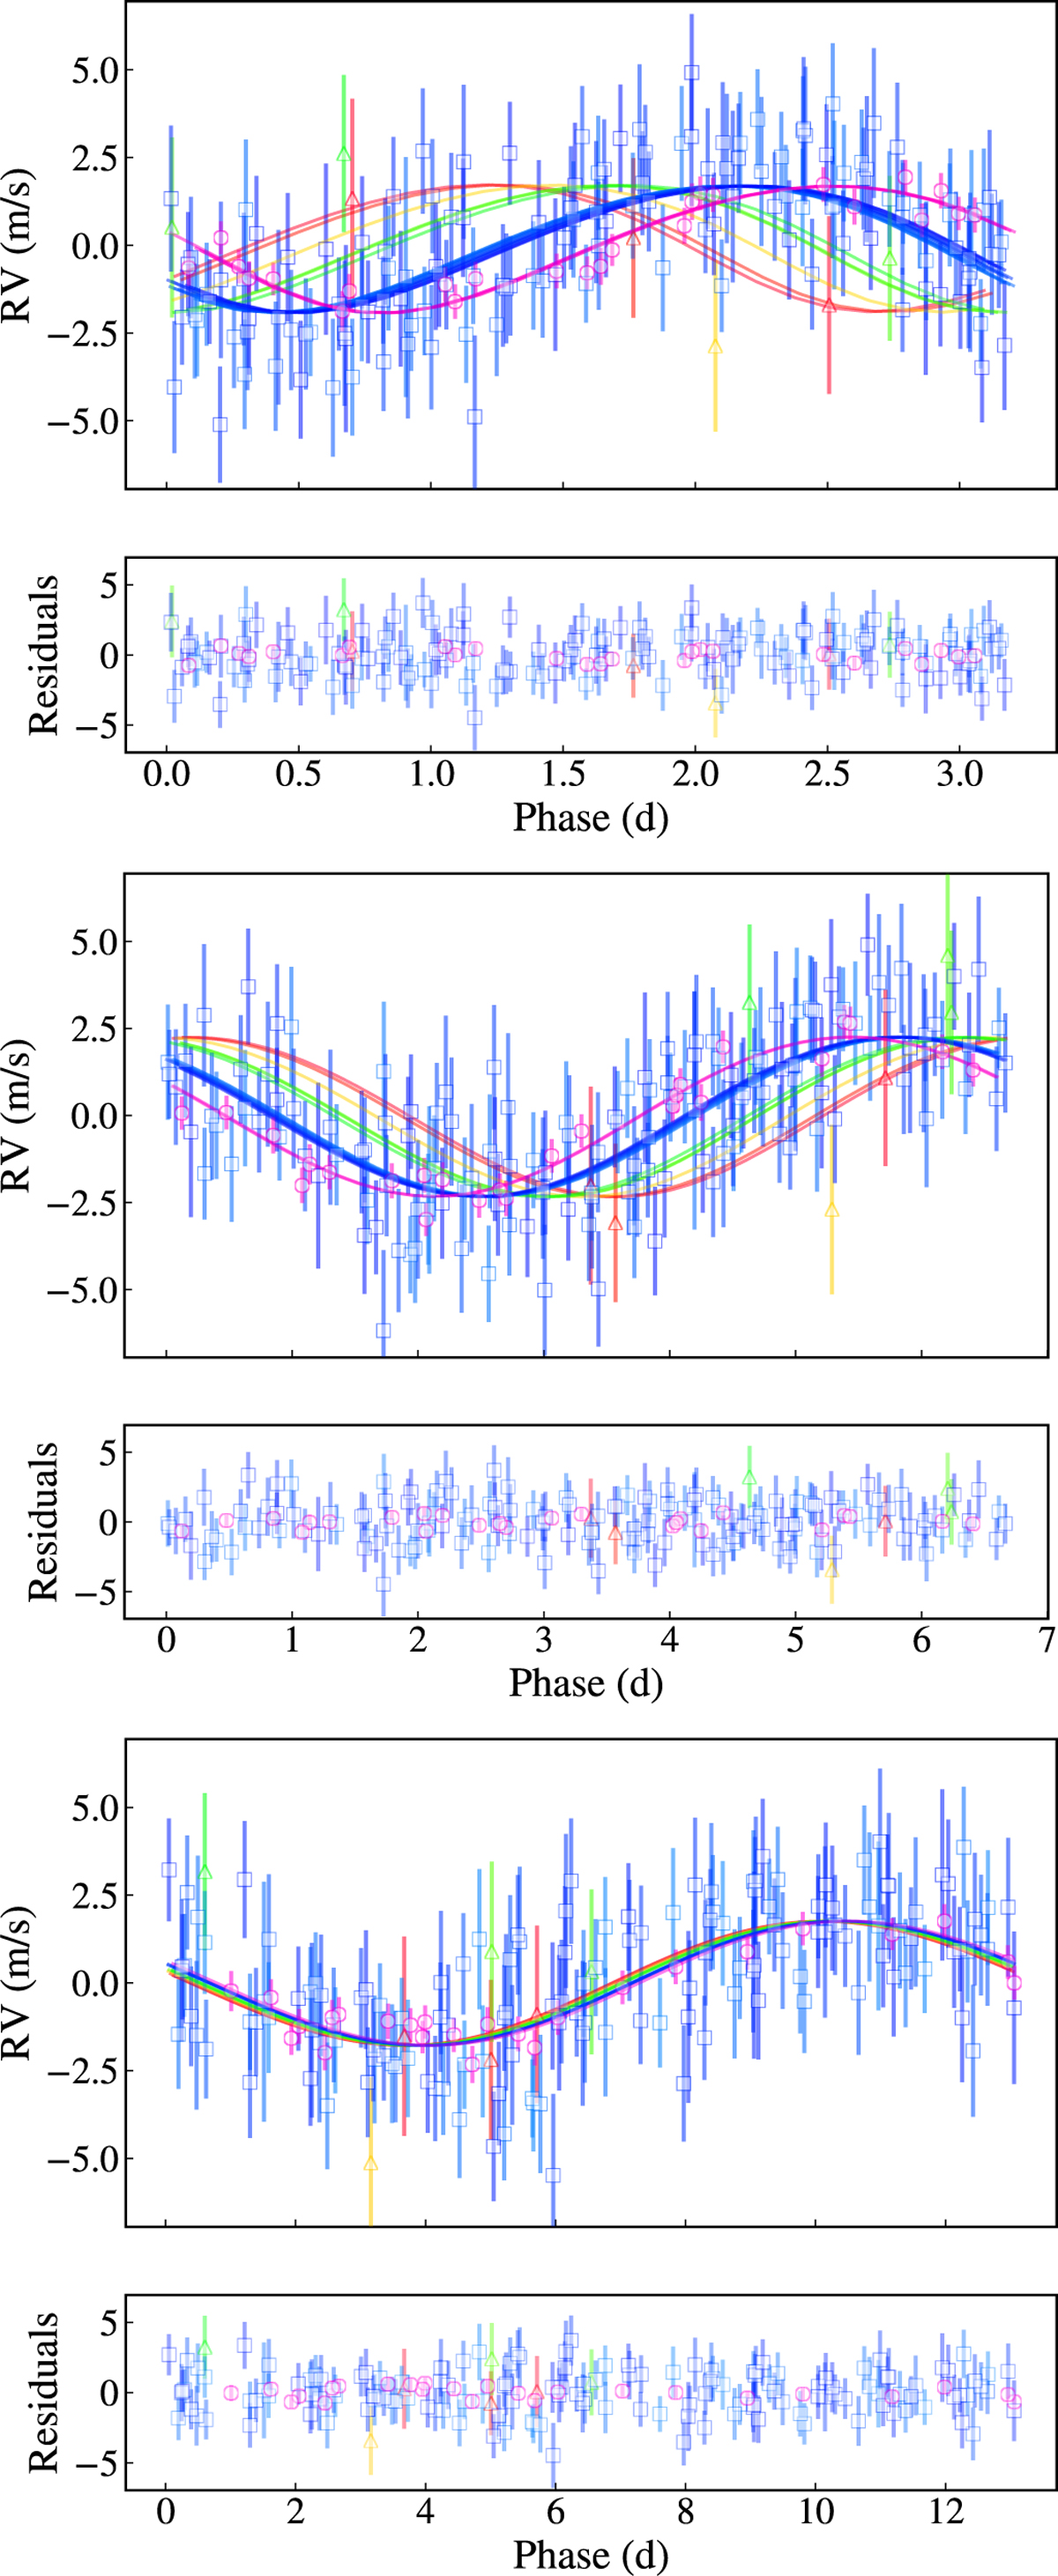
Fig. 6
Download original image
Data versus model D5 (Table 3) for planets b, c, and d from top to bottom: to show the temporal evolution of the planet’s orbits, the colour of the data and the model changes from blue to red over the observational baseline to visualise the non-Keplerian orbit due to the planet-planet interaction noticeable as a phase shift. A similar figure, but separated into observing seasons is shown in Fig. D.2.
Current usage metrics show cumulative count of Article Views (full-text article views including HTML views, PDF and ePub downloads, according to the available data) and Abstracts Views on Vision4Press platform.
Data correspond to usage on the plateform after 2015. The current usage metrics is available 48-96 hours after online publication and is updated daily on week days.
Initial download of the metrics may take a while.