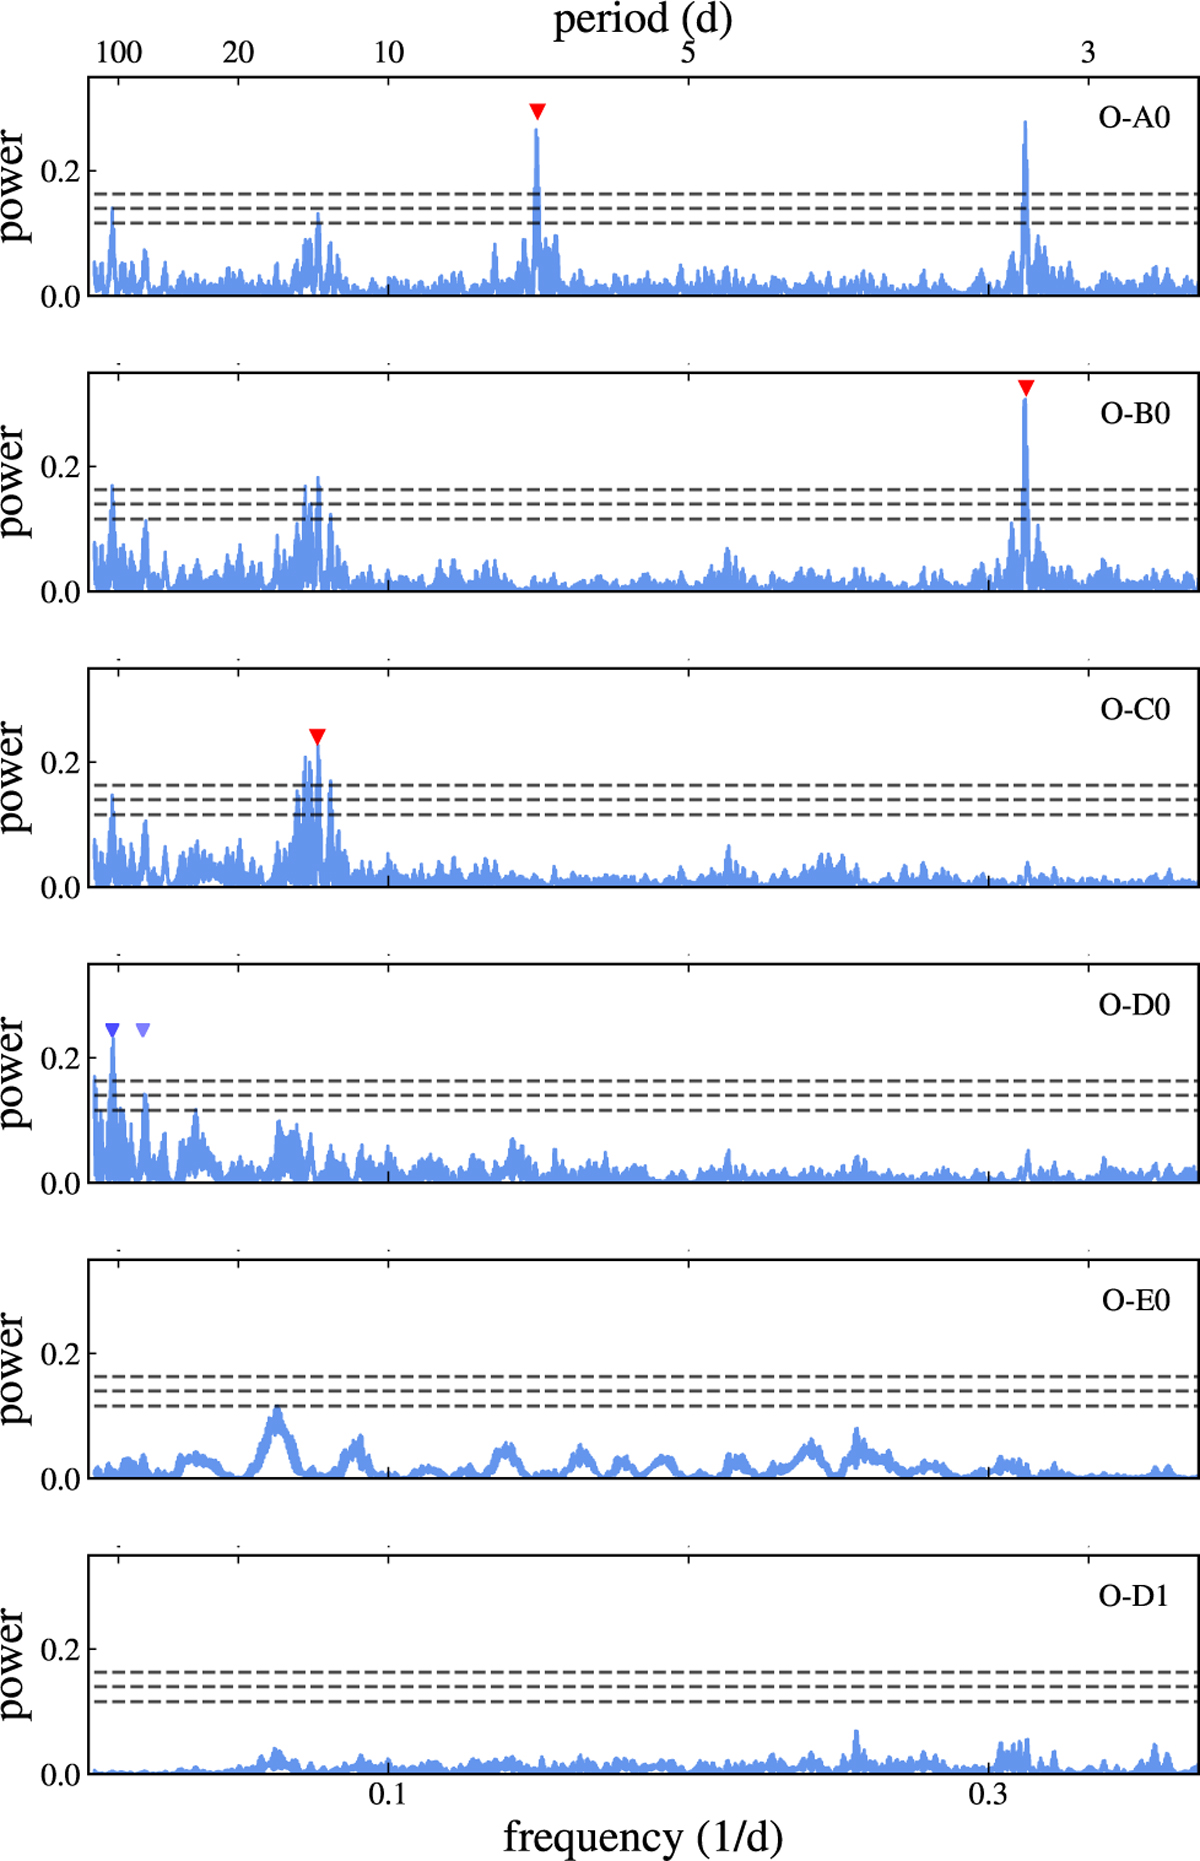
Fig. 4

Download original image
Periodograms of models with an increasing complexity: from top to bottom: zero, one, two, and three planets as well as three planets + SHO kernel. Red arrows mark the subtracted signal for the following periodogram, the blue arrow indicates the potential stellar rotation period at ~125 d, the light blue arrow points at the 55 d signal. The labels indicate the model which is subtracted from the observation ‘O’ (see Table 3).
Current usage metrics show cumulative count of Article Views (full-text article views including HTML views, PDF and ePub downloads, according to the available data) and Abstracts Views on Vision4Press platform.
Data correspond to usage on the plateform after 2015. The current usage metrics is available 48-96 hours after online publication and is updated daily on week days.
Initial download of the metrics may take a while.


