Fig. 2
Download original image
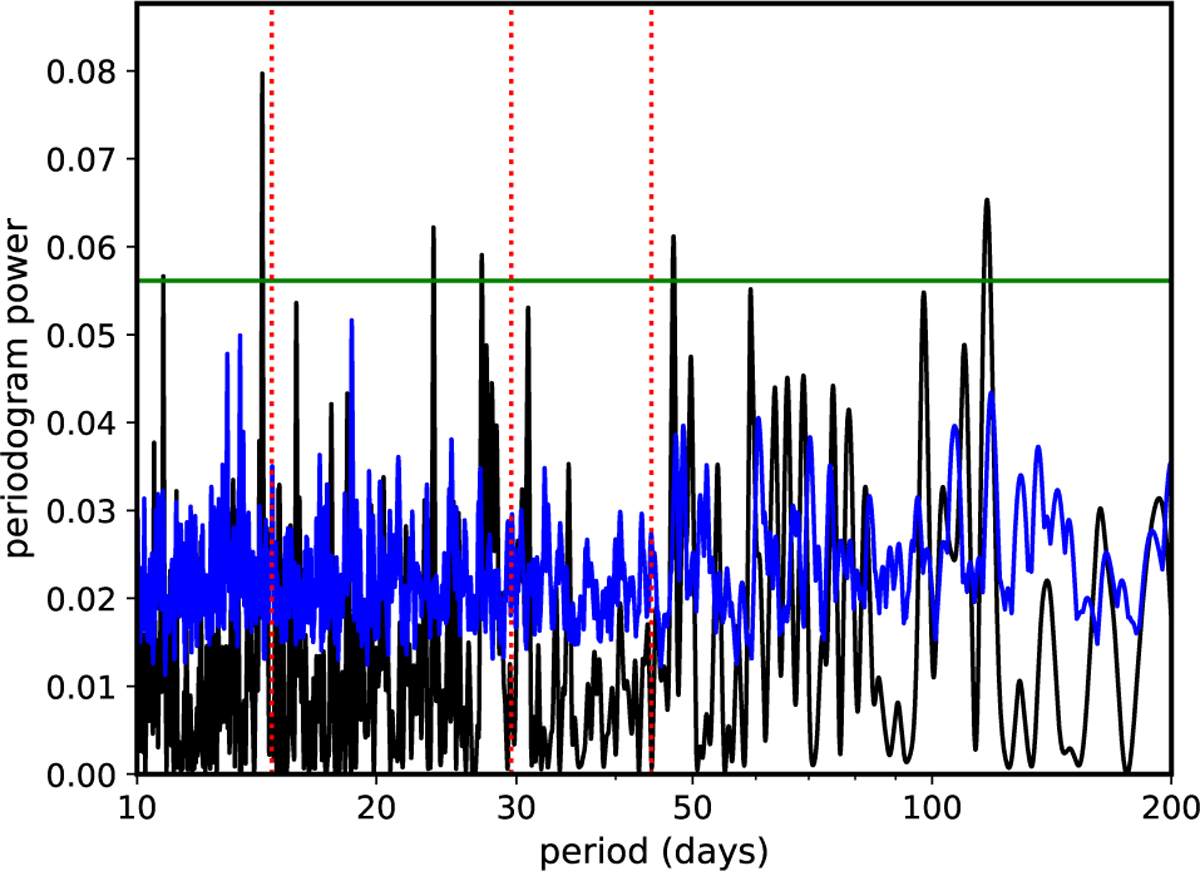
Lomb-Scargle periodogram of the ATLAS c-band photometry of GJ 1061. The green-line is the p = 0.01 false-alarm threshold calculated using, and the blue curve is the maximum of the ensemble of 100 periograms of the randomly scrambled photometry. The red dotted lines mark the lunar synoptic period and its 1:2 and 3:2 harmonics.
Current usage metrics show cumulative count of Article Views (full-text article views including HTML views, PDF and ePub downloads, according to the available data) and Abstracts Views on Vision4Press platform.
Data correspond to usage on the plateform after 2015. The current usage metrics is available 48-96 hours after online publication and is updated daily on week days.
Initial download of the metrics may take a while.