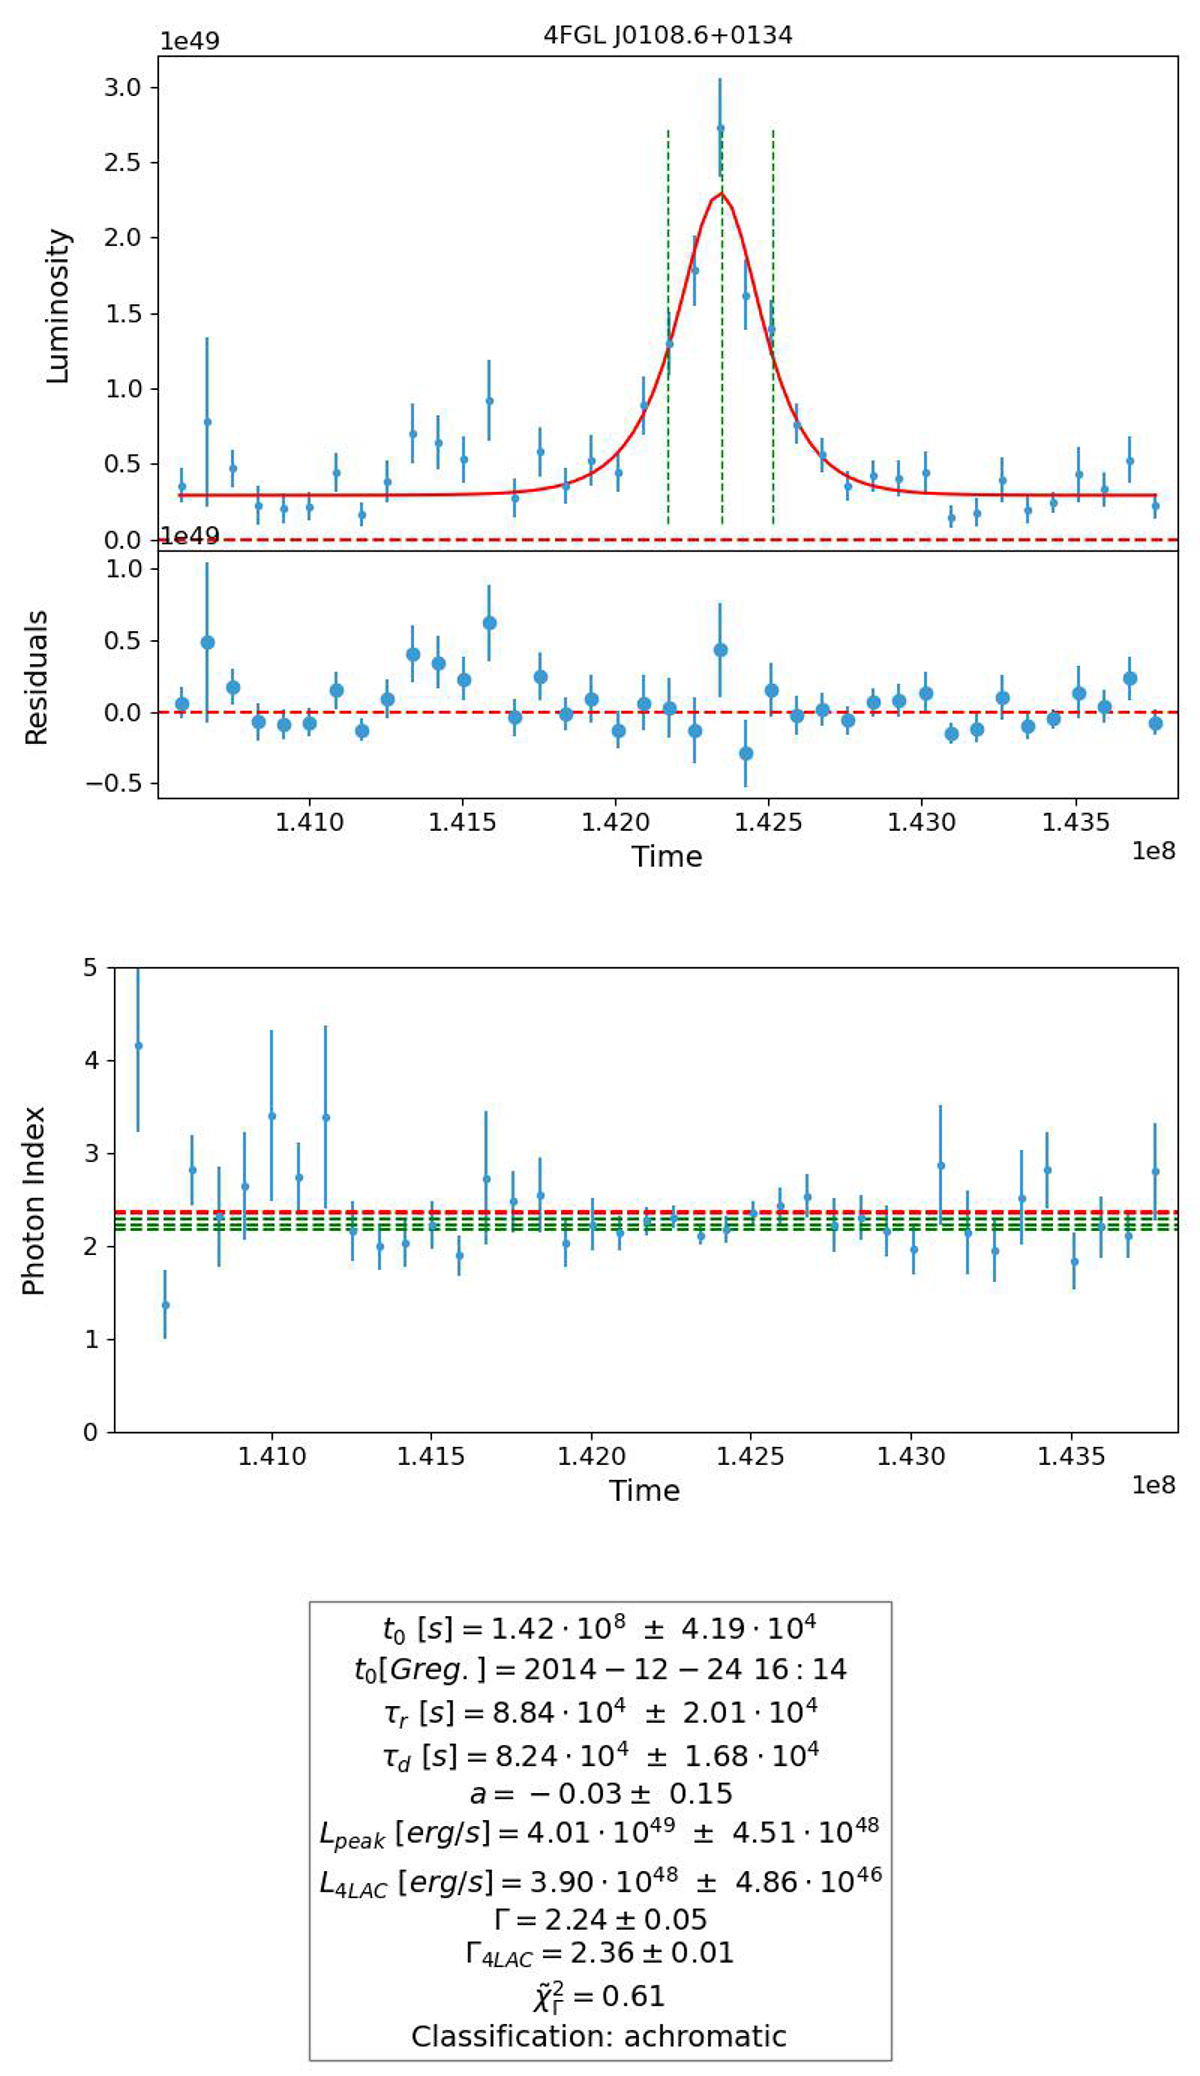
Fig. 3.

Download original image
From top to bottom: Luminosity vs. time (the vertical green lines indicate t0 (the central one), t0 − 2τr (on the left), and t0 + 2τd (on the right); the red line represents the fit function); Residuals vs. time; Photon index vs. time (the horizontal green lines show the best-fit value of Γ plus or minus its uncertainty; the horizontal red lines show the same but for Γ4LAC); and the parameter values (see text) for one of the GRBBLs identified in 4FGL J0108.6+0134.
Current usage metrics show cumulative count of Article Views (full-text article views including HTML views, PDF and ePub downloads, according to the available data) and Abstracts Views on Vision4Press platform.
Data correspond to usage on the plateform after 2015. The current usage metrics is available 48-96 hours after online publication and is updated daily on week days.
Initial download of the metrics may take a while.


