Open Access
Fig. 2.
Download original image
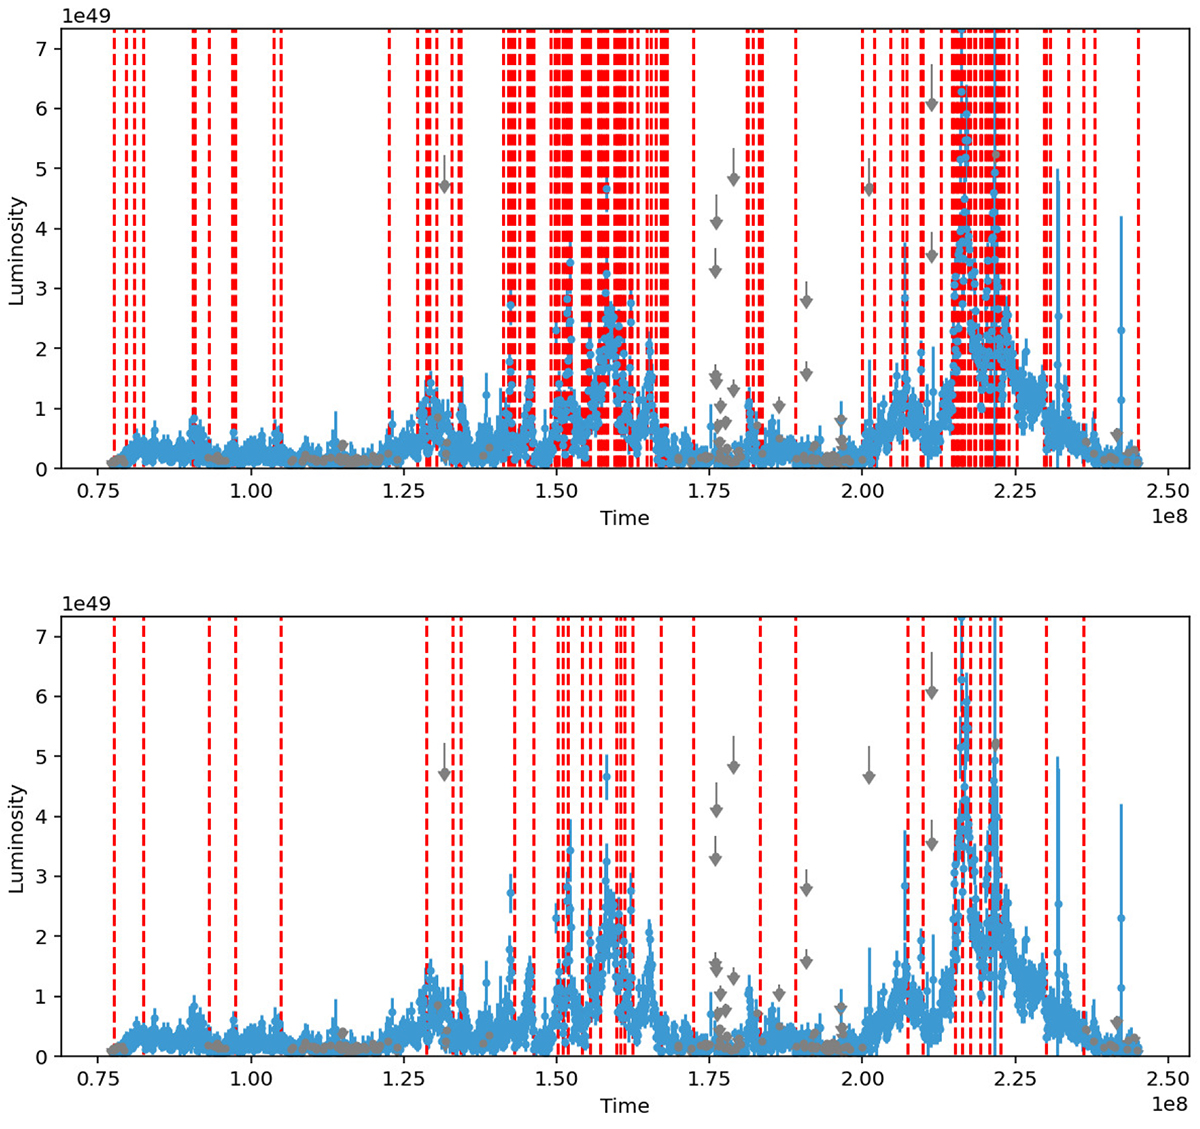
Light curve (luminosity vs. time) of 4FGL J0108.6+0134, with a three day binning. The vertical red lines represent the segmentation by the Bayesian blocks algorithm with pBB = 0.1 (top), and by the merged superblocks (bottom, see text for their definition).
Current usage metrics show cumulative count of Article Views (full-text article views including HTML views, PDF and ePub downloads, according to the available data) and Abstracts Views on Vision4Press platform.
Data correspond to usage on the plateform after 2015. The current usage metrics is available 48-96 hours after online publication and is updated daily on week days.
Initial download of the metrics may take a while.