Fig. 8.
Download original image
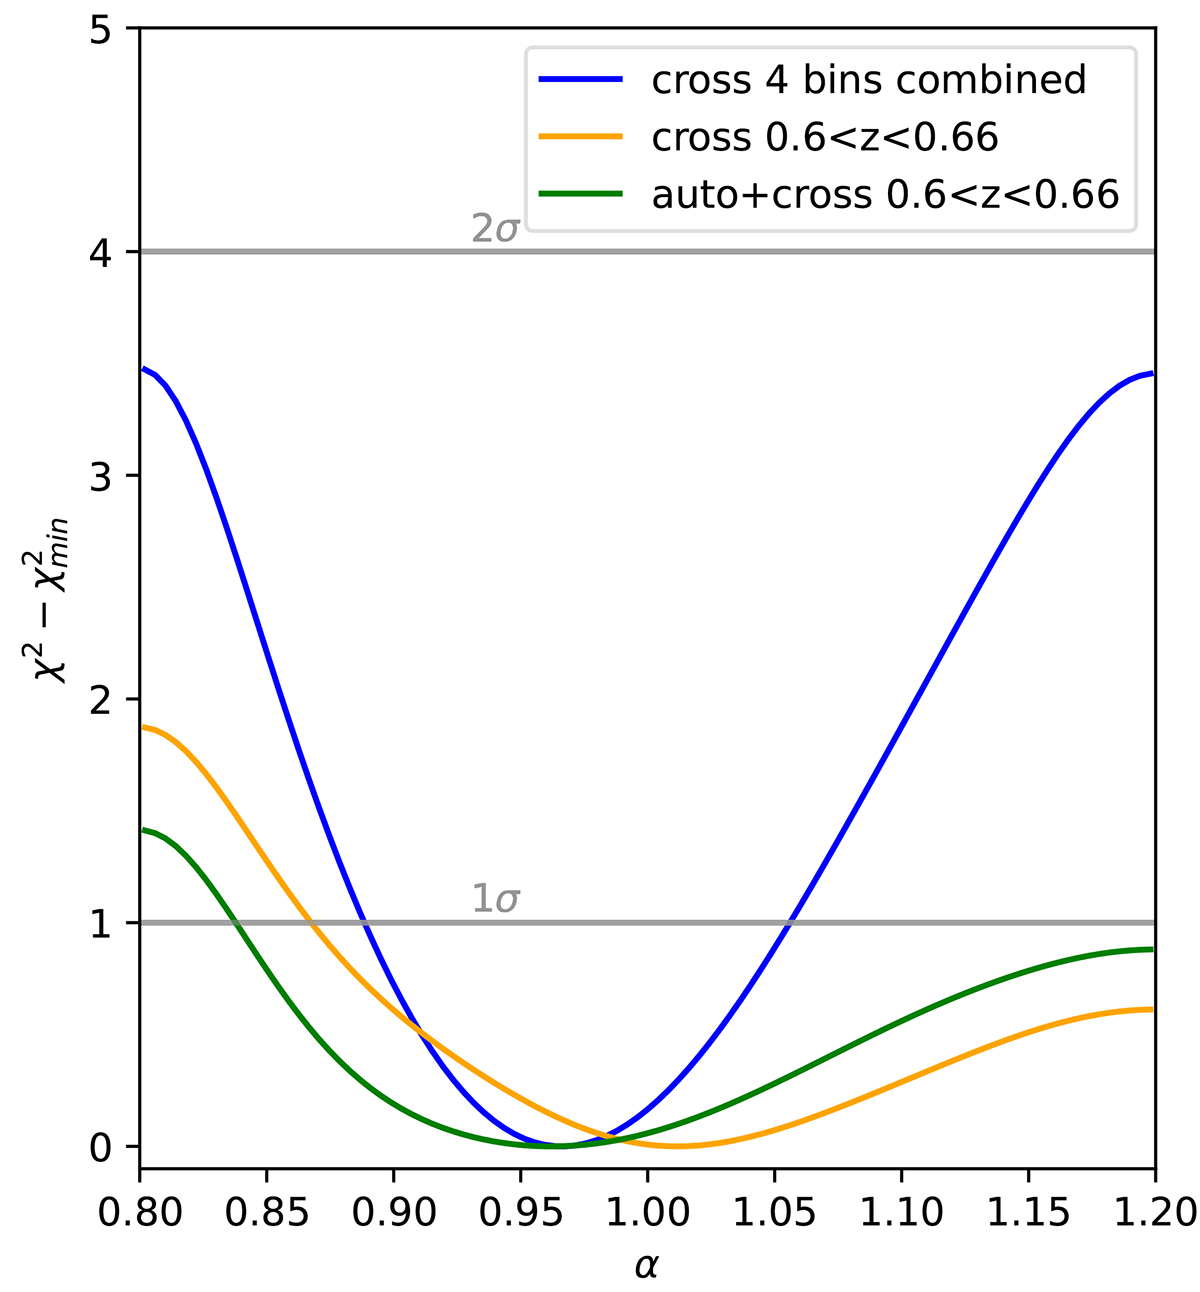
Δχ2 ≡ χ2 − χmin2 of the BAO constraints. The orange curve shows the BAO parameter α that is MCMC fitted using the cross angular power spectrum between LoTSS and eBOSS within one eBOSS redshift bin 0.6 < z < 0.66; the blue curve shows the α parameter combining four eBOSS redshift bins in the cross angular power spectrum. The green curve shows the eBOSS auto angular power spectrum combined with cross angular power spectrum in the first redshift bin 0.6 < z < 0.66. The grey lines at 1σ and 2σ correspond to the 68% and 95% confidence intervals, respectively, under the assumption of a Gaussian distribution for the parameter.
Current usage metrics show cumulative count of Article Views (full-text article views including HTML views, PDF and ePub downloads, according to the available data) and Abstracts Views on Vision4Press platform.
Data correspond to usage on the plateform after 2015. The current usage metrics is available 48-96 hours after online publication and is updated daily on week days.
Initial download of the metrics may take a while.