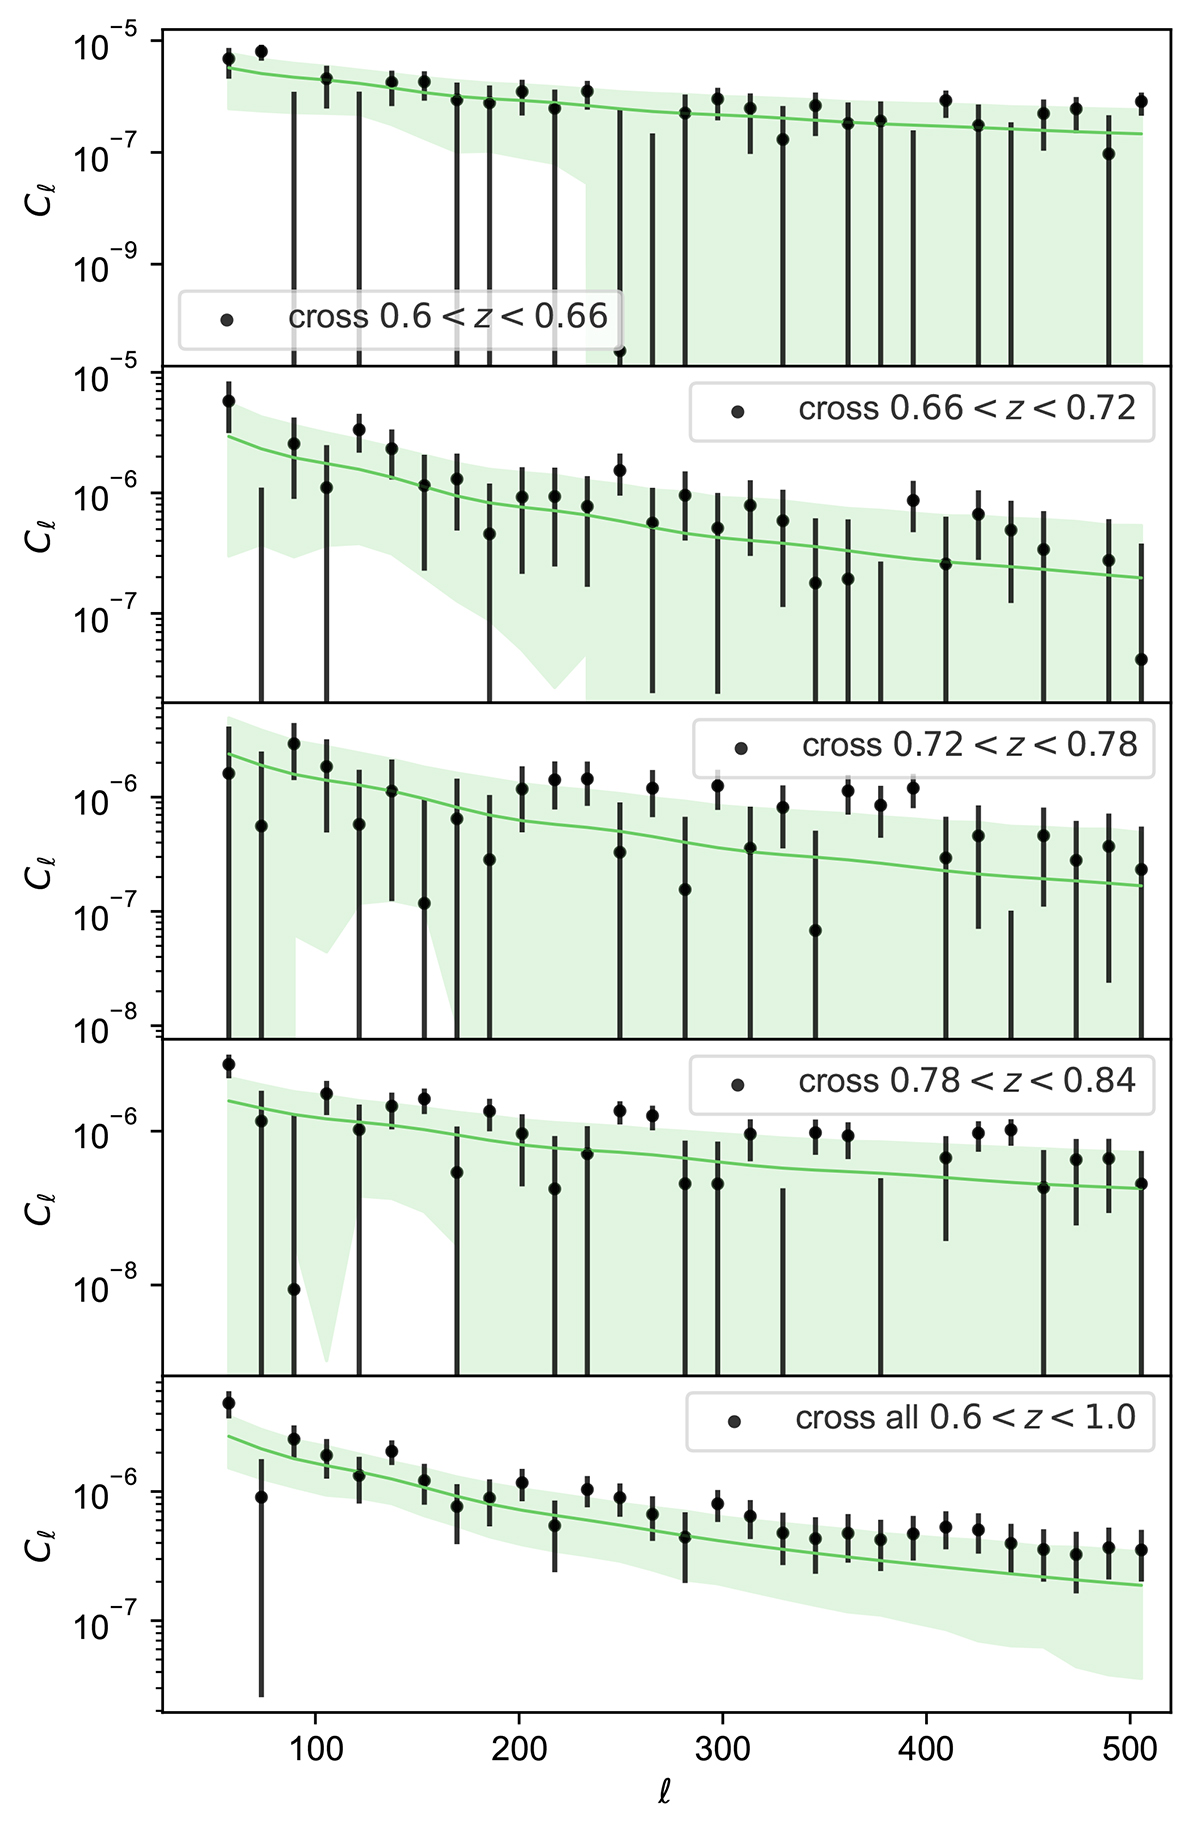
Fig. 5.
Download original image
LoTSS and eBOSS cross-correlation mean Cℓ values (green curves) from the mocks are contrasted with the measured Cℓ values from the real catalogue (black points with error bars) in different redshift bins. The error bars indicate measurement uncertainties, which are derived from the covariance matrices computed from 1000 mocks.
Current usage metrics show cumulative count of Article Views (full-text article views including HTML views, PDF and ePub downloads, according to the available data) and Abstracts Views on Vision4Press platform.
Data correspond to usage on the plateform after 2015. The current usage metrics is available 48-96 hours after online publication and is updated daily on week days.
Initial download of the metrics may take a while.