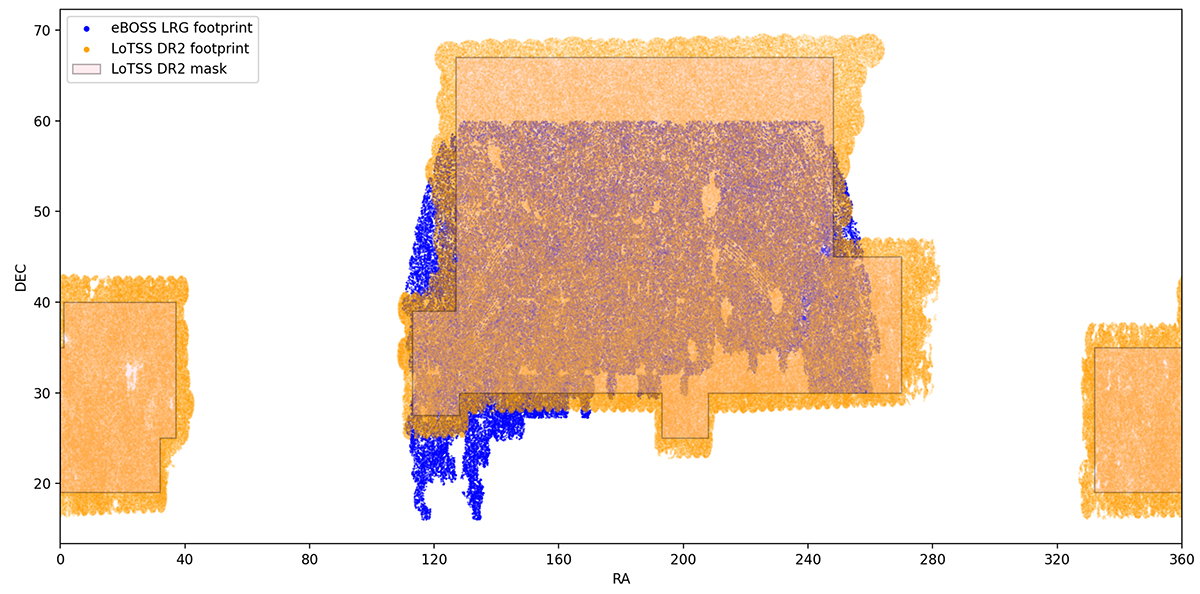
Fig. 1.
Download original image
Footprint covered by the LoTSS DR2 (in orange) and eBOSS LRGs NGC(in blue), plotted against right ascension (RA) and declination (Dec). This visualisation highlights the significant overlap between the two surveys, which allows for a cross-correlation analysis. The mask applied on the LoTSS DR2 data (in pink shaded region with black edge) is also shown.
Current usage metrics show cumulative count of Article Views (full-text article views including HTML views, PDF and ePub downloads, according to the available data) and Abstracts Views on Vision4Press platform.
Data correspond to usage on the plateform after 2015. The current usage metrics is available 48-96 hours after online publication and is updated daily on week days.
Initial download of the metrics may take a while.