Fig. 9
Download original image
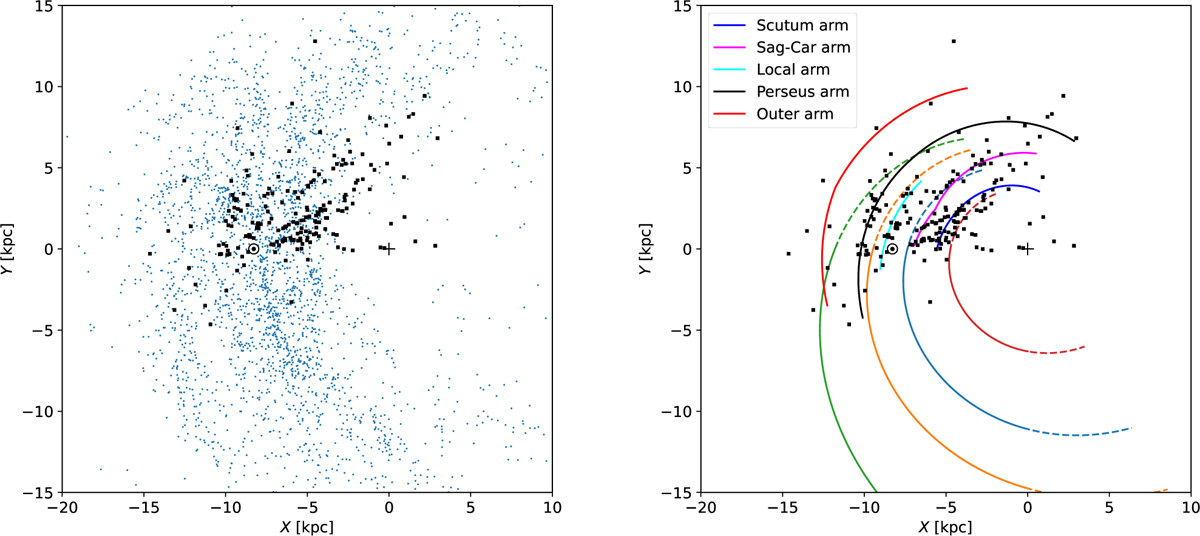
Comparison between Cepheids and maser sources. Left panel: comparison of the Cepheid sample (blue dots) with the masers from R19, shown as black squares. Right panel: comparison between the spiral model derived in this work (the colours of the spiral arms are the same as in previous figures) and the spiral arm model from R19 based on the masers.
Current usage metrics show cumulative count of Article Views (full-text article views including HTML views, PDF and ePub downloads, according to the available data) and Abstracts Views on Vision4Press platform.
Data correspond to usage on the plateform after 2015. The current usage metrics is available 48-96 hours after online publication and is updated daily on week days.
Initial download of the metrics may take a while.