Fig. 8
Download original image
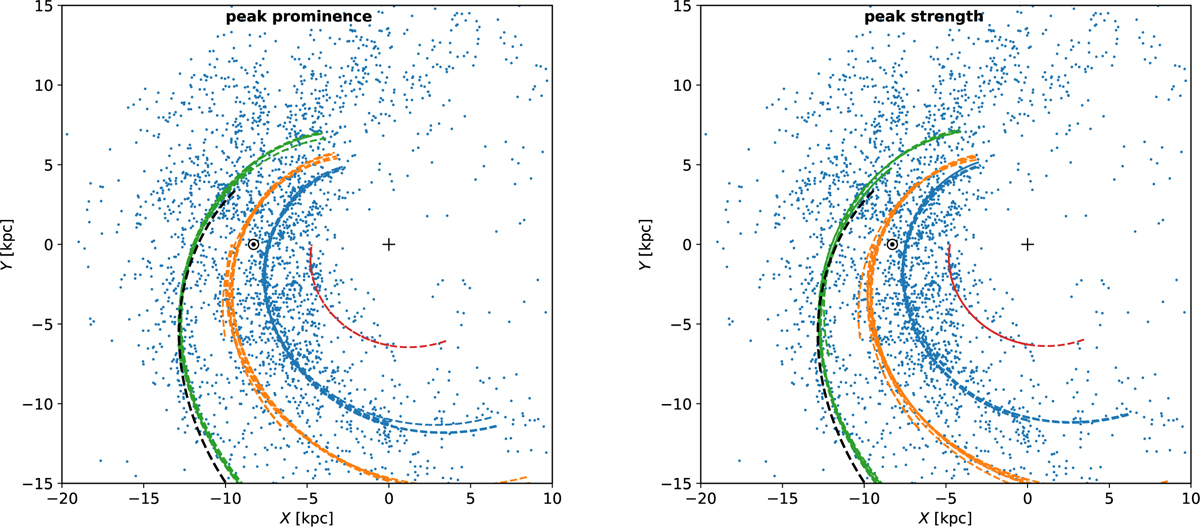
XY distribution of the dynamically young Cepheids, overplotted with the arms from all considered azimuth ranges. The red curve corresponds to the Scutum arm, the blue curve shows the Sagittarius-Carina arm, the gold curve shows the Local (Orion) arm, and the green curve shows the Perseus arm. The dashed black curve is an arm detected by Levine et al. (2006) in the HI. For an interactive version of this plot see https://gaia-unlimited.org/map-of-milky-way-cepheid-variables/
Current usage metrics show cumulative count of Article Views (full-text article views including HTML views, PDF and ePub downloads, according to the available data) and Abstracts Views on Vision4Press platform.
Data correspond to usage on the plateform after 2015. The current usage metrics is available 48-96 hours after online publication and is updated daily on week days.
Initial download of the metrics may take a while.