Fig. 2.
Download original image
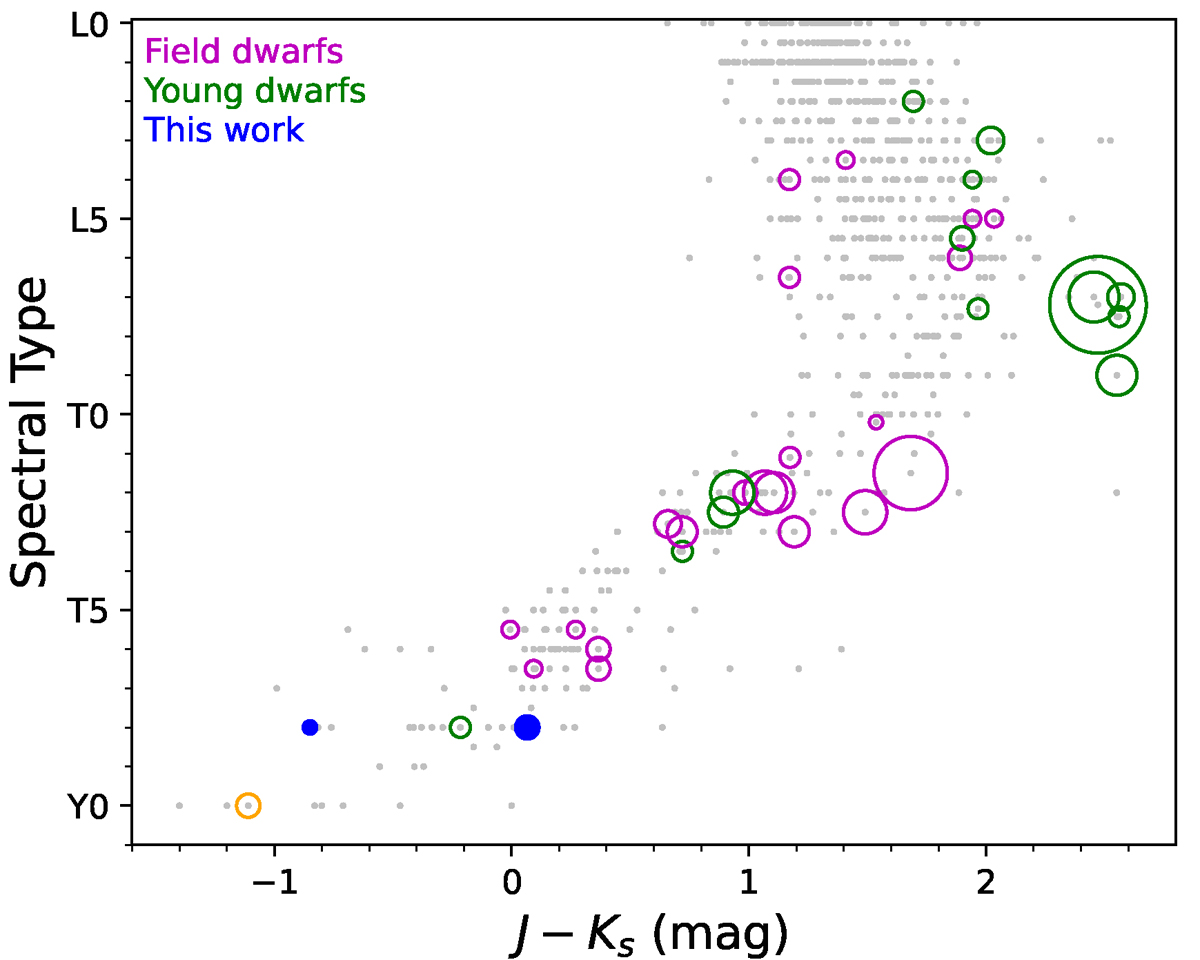
Spectral type as a function of J − Ks color for known L, T, and Y dwarfs from the compilation presented in Best et al. (2024, gray symbols). Objects with a detection of J-band photometric variability are plotted in green for those thought to be young and magenta for those considered to have field ages. Their symbol size is proportional to the measured peak-to-peak amplitude. EQ J1959-3338 and 2MASS J09393548-2448279 are plotted with blue symbols. The open orange circle denotes the upper limit detection of the Y0 dwarf WISEP J173835.52+273258.9 (Leggett et al. 2016b). The different detections of J-band variability are taken from Clarke et al. (2008), Artigau et al. (2009), Radigan et al. (2014, 2014), Buenzli et al. (2015), Lew et al. (2016, 2020), Croll et al. (2016), Biller et al. (2018), Manjavacas et al. (2019), Vos et al. (2019), Miles-Páez et al. (2019), Eriksson et al. (2019), Bowler et al. (2020), Liu et al. (2024).
Current usage metrics show cumulative count of Article Views (full-text article views including HTML views, PDF and ePub downloads, according to the available data) and Abstracts Views on Vision4Press platform.
Data correspond to usage on the plateform after 2015. The current usage metrics is available 48-96 hours after online publication and is updated daily on week days.
Initial download of the metrics may take a while.