Fig. 1.
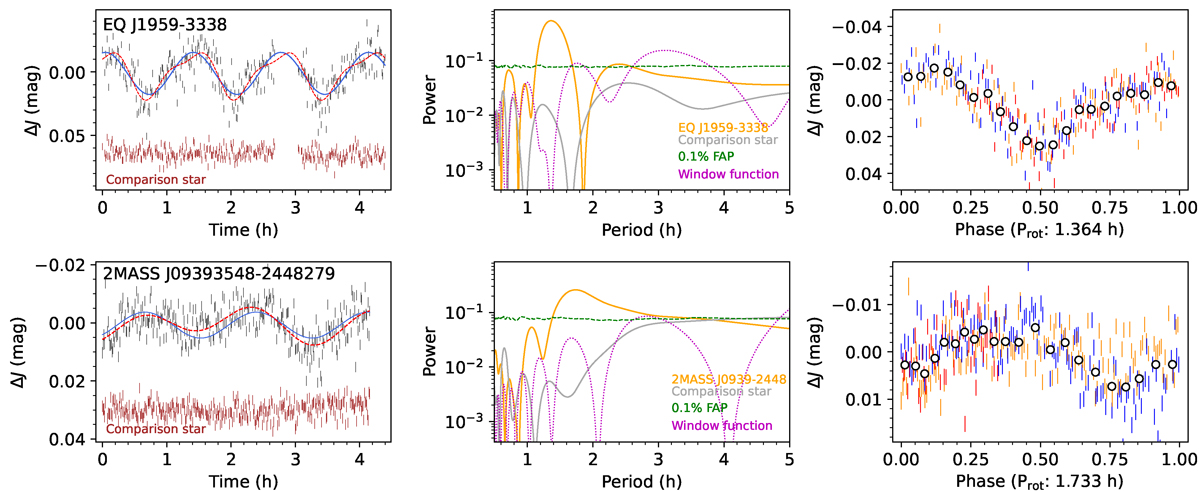
Download original image
Left: J-band differential photometry of EQ J1959-3338 (top) and 2MASS J09393548-2448279 (bottom). Gray points represent 20 s photometric measurements, with symbol size indicating uncertainty. Comparison stars (brown symbols) are also shown. Data are vertically shifted for clarity. Best fits using a first-order truncated Fourier series (blue line) and a second-order series (red dashed line) are overlaid. Middle: Lomb-Scargle periodogram of the left-panel time series. Targets (orange line) show strong periodicity at 1.4–1.9 h with 99.9% confidence (green line), while comparison stars (gray line) show no significant periodicity. Right: Phase-folded light curves of the targets, covering 2.9 (EQ J1959-3338) and 2.3 (2MASS J09393548-2448279) rotation cycles. Different colors (blue, orange, and red) represent separate cycles. Open circles show data binned every 15 points (≈5 min).
Current usage metrics show cumulative count of Article Views (full-text article views including HTML views, PDF and ePub downloads, according to the available data) and Abstracts Views on Vision4Press platform.
Data correspond to usage on the plateform after 2015. The current usage metrics is available 48-96 hours after online publication and is updated daily on week days.
Initial download of the metrics may take a while.