Fig. 4
Download original image
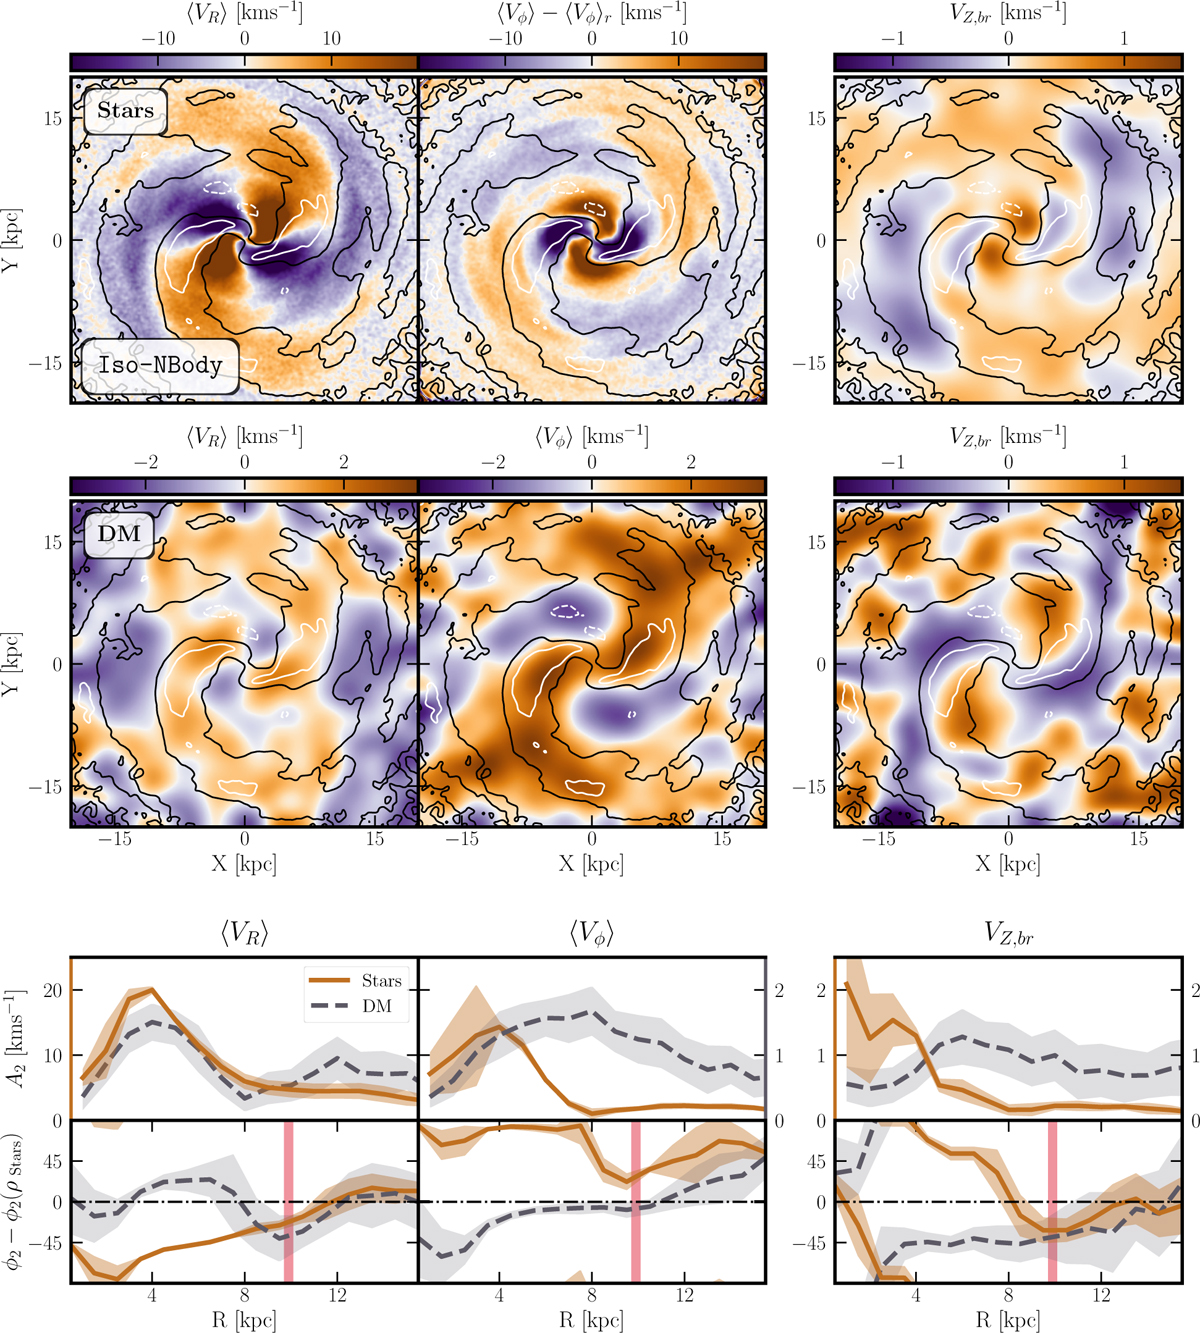
Kinematic analysis of the Iso-NBody simulation, at t = 7 Gyr. The contours represent the regions where δρr = 0 (in black) and δρr = ± 0.2 (in white). We show ⟨VR⟩ (left column), ⟨Vϕ⟩ (middle column), and VZ, br (right column). First row: kinematic maps of the stellar component. Second row: kinematic maps of the DM component. Third row: radial profile of the kinematic amplitude of the Fourier mode (A2) for the stellar (solid ochre) and DM (dashed grey) components. Fourth row: radial profile of the phase difference between each kinematic mode (ϕ2) and the stellar spiral in density (ϕ2(ρStars)). The co-rotation radii of the spirals (RC R ∼ 10 kpc) is shown as a vertical red strip.
Current usage metrics show cumulative count of Article Views (full-text article views including HTML views, PDF and ePub downloads, according to the available data) and Abstracts Views on Vision4Press platform.
Data correspond to usage on the plateform after 2015. The current usage metrics is available 48-96 hours after online publication and is updated daily on week days.
Initial download of the metrics may take a while.