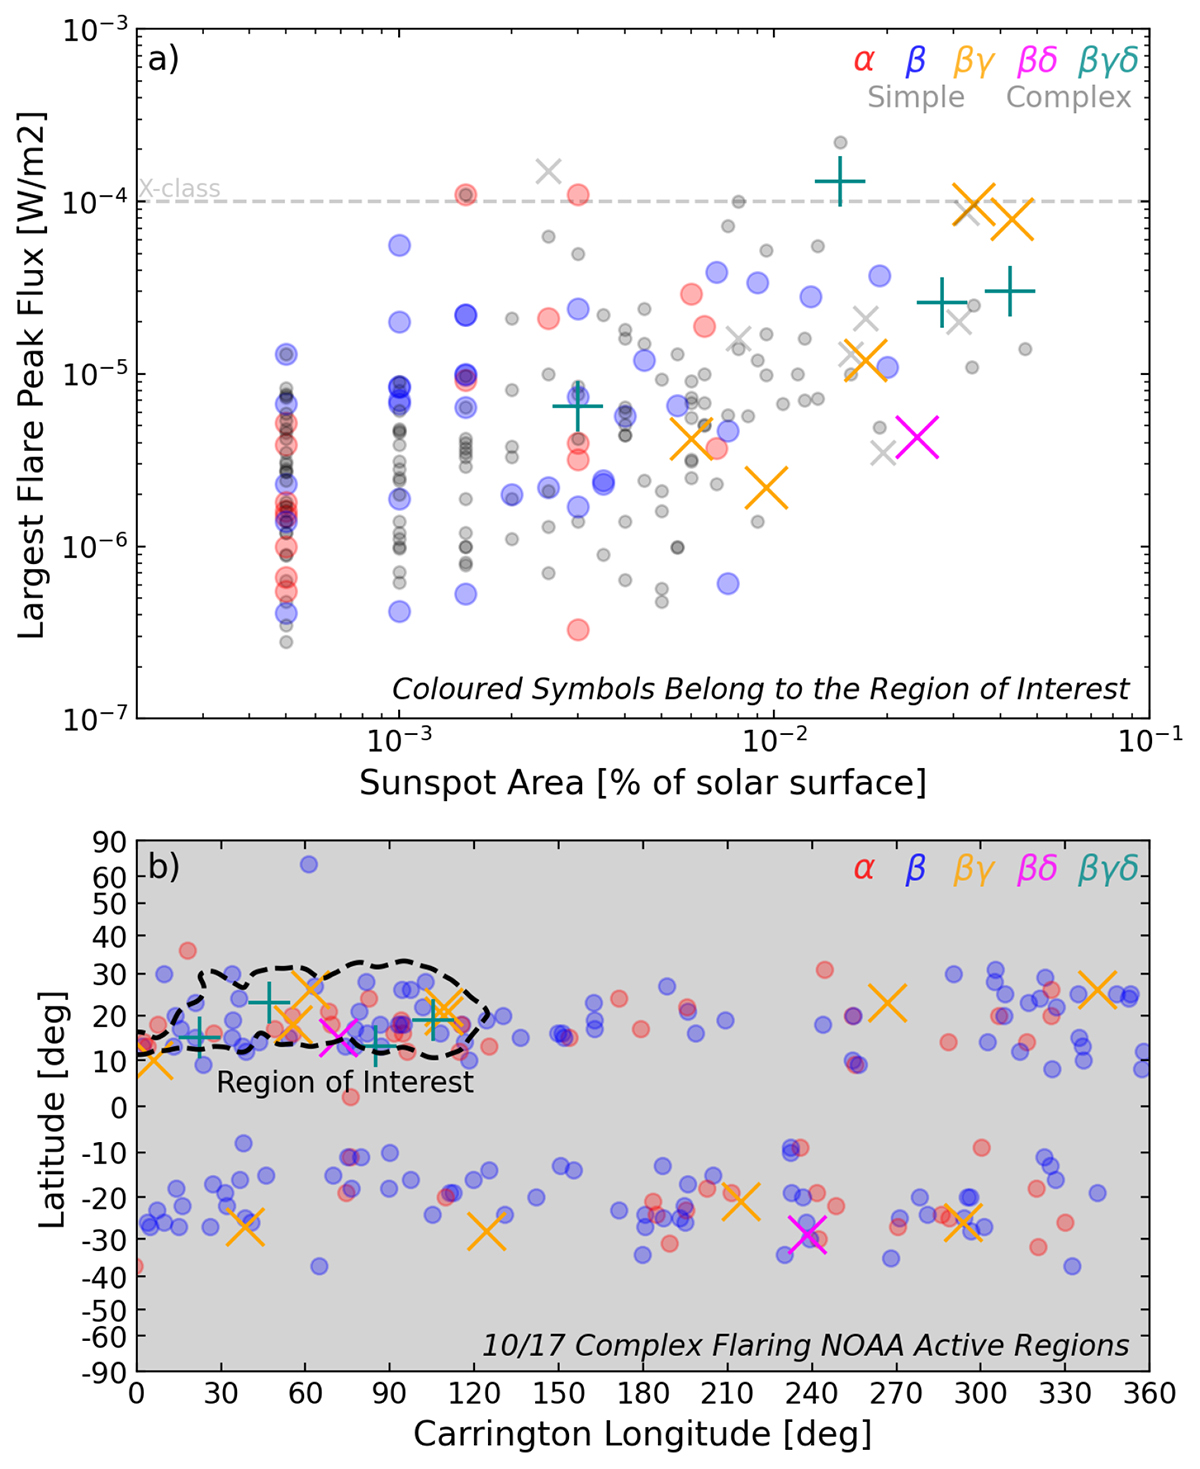
Fig. 9.
Download original image
Comparison of the peak flux of the strongest flares from NOAA ARs with their Hale classification. Panel (a): Peak flare flux for each NOAA AR in 2022 vs. their maximum sunspot area. NOAA ARs that were associated with the AR nest are coloured with larger symbols, and the others are shown in grey. Panel (b): Location of these NOAA ARs in Carrington coordinates.
Current usage metrics show cumulative count of Article Views (full-text article views including HTML views, PDF and ePub downloads, according to the available data) and Abstracts Views on Vision4Press platform.
Data correspond to usage on the plateform after 2015. The current usage metrics is available 48-96 hours after online publication and is updated daily on week days.
Initial download of the metrics may take a while.