Fig. 7.

Download original image
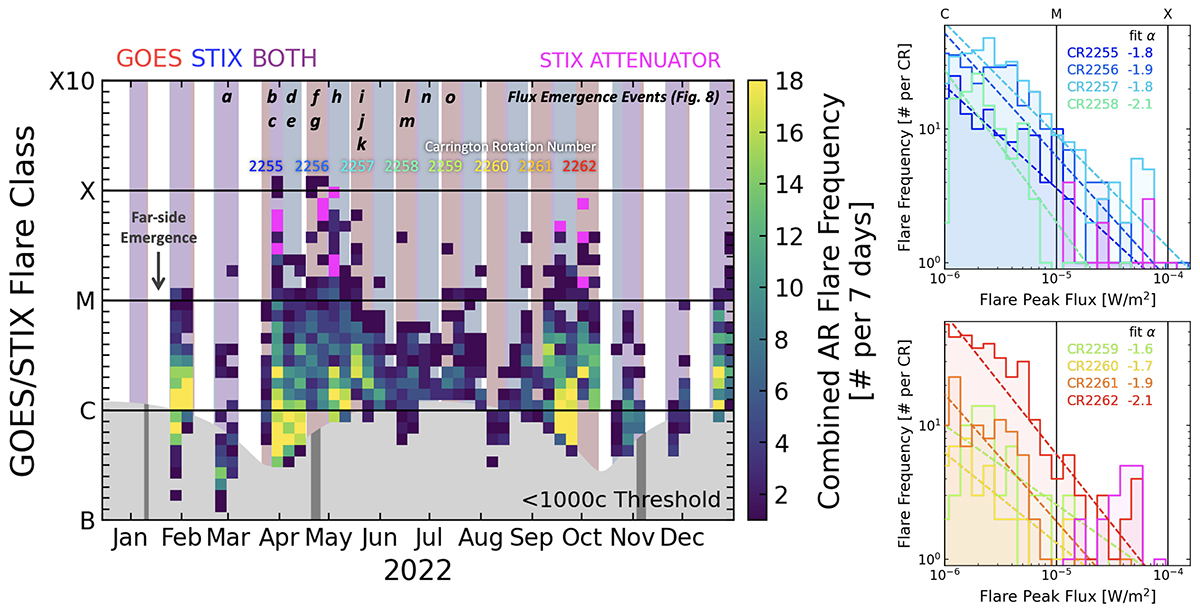
Combined histogram of solar flares observed by GOES and STIX from the AR nest in 2022. Left panel: Visibility to GOES, STIX, or both (red, blue, and purple background colour). Bins that contain one or more flare that triggered the STIX attenuator are highlighted in magenta (the fluxes of these events were not corrected). The STIX 1000 count threshold is shown in light grey. Intervals when STIX was offline are represented by dark grey bars in the count threshold. The flux emergence events from Fig. 8 are labelled (a) to (o). Right panels: Distribution of solar flares in eight CR bins from 2255 to 2262 that span the period of nearly continuous observations.
Current usage metrics show cumulative count of Article Views (full-text article views including HTML views, PDF and ePub downloads, according to the available data) and Abstracts Views on Vision4Press platform.
Data correspond to usage on the plateform after 2015. The current usage metrics is available 48-96 hours after online publication and is updated daily on week days.
Initial download of the metrics may take a while.


