Fig. 6.
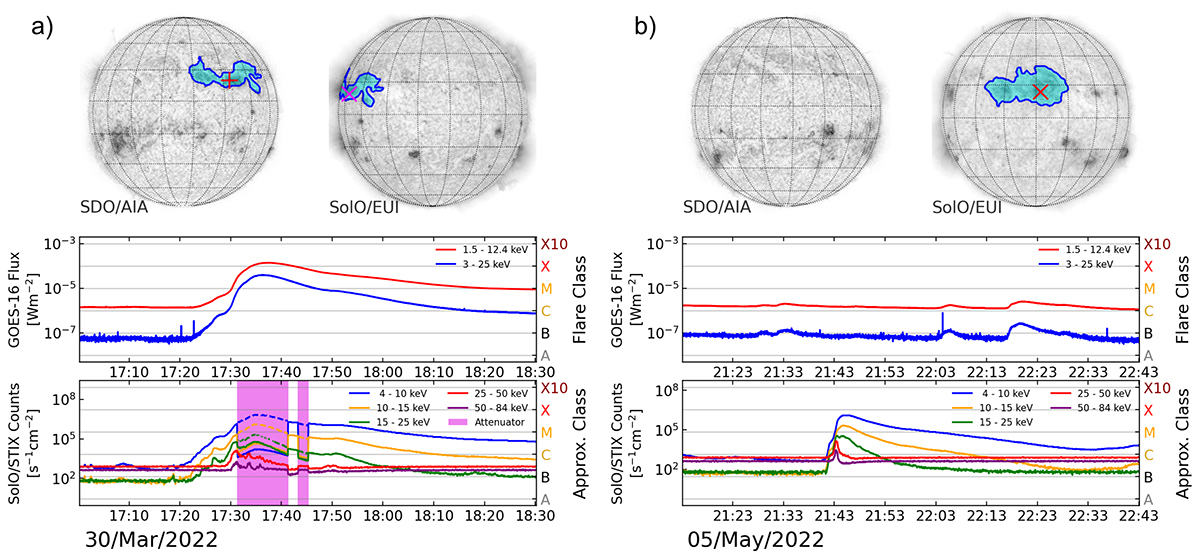
Download original image
Solar flare light curves and locations as viewed from Earth and Solar Orbiter. The times are given in UTC. Panel (a): X-class flare from 30 March 2022, whilst Solar Orbiter was in quadrature with Earth. The magenta background indicates the time ranges when the attenuator was inserted. The dashed lines show the corrected count rate based on the pre- and post-attenuator values. Panel (b): M-class flare from 5 May 2022, when Solar Orbiter was on the far side of the Sun to Earth.
Current usage metrics show cumulative count of Article Views (full-text article views including HTML views, PDF and ePub downloads, according to the available data) and Abstracts Views on Vision4Press platform.
Data correspond to usage on the plateform after 2015. The current usage metrics is available 48-96 hours after online publication and is updated daily on week days.
Initial download of the metrics may take a while.