Fig. 5.
Download original image
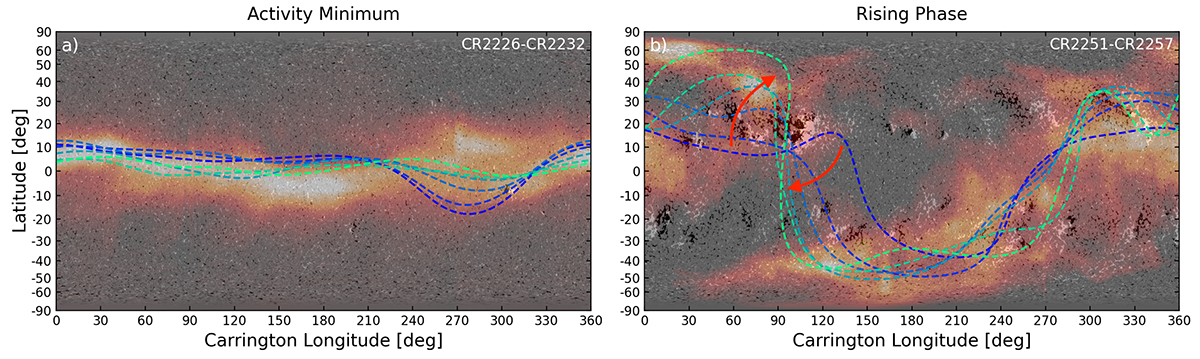
Evolution of the heliospheric current sheet during (a) solar minimum in late 2019 and (b) the rising phase of sunspot cycle 25 in early 2022, when the AR nest emerged. Each panel contains information spanning six CRs and is labelled in the top right corner of each panel. The background greyscale shows a HMI magnetogram from the middle of each CR range. The orange colour gradient shows the average LASCO-C2 scattered white-light brightness at three solar radii during each CR range. The dashed coloured lines show the heliospheric current sheets from potential field source surface models driven by the six corresponding CR magnetograms (blue to green). The impact of the AR nest on the current sheet is highlighted with red arrows.
Current usage metrics show cumulative count of Article Views (full-text article views including HTML views, PDF and ePub downloads, according to the available data) and Abstracts Views on Vision4Press platform.
Data correspond to usage on the plateform after 2015. The current usage metrics is available 48-96 hours after online publication and is updated daily on week days.
Initial download of the metrics may take a while.