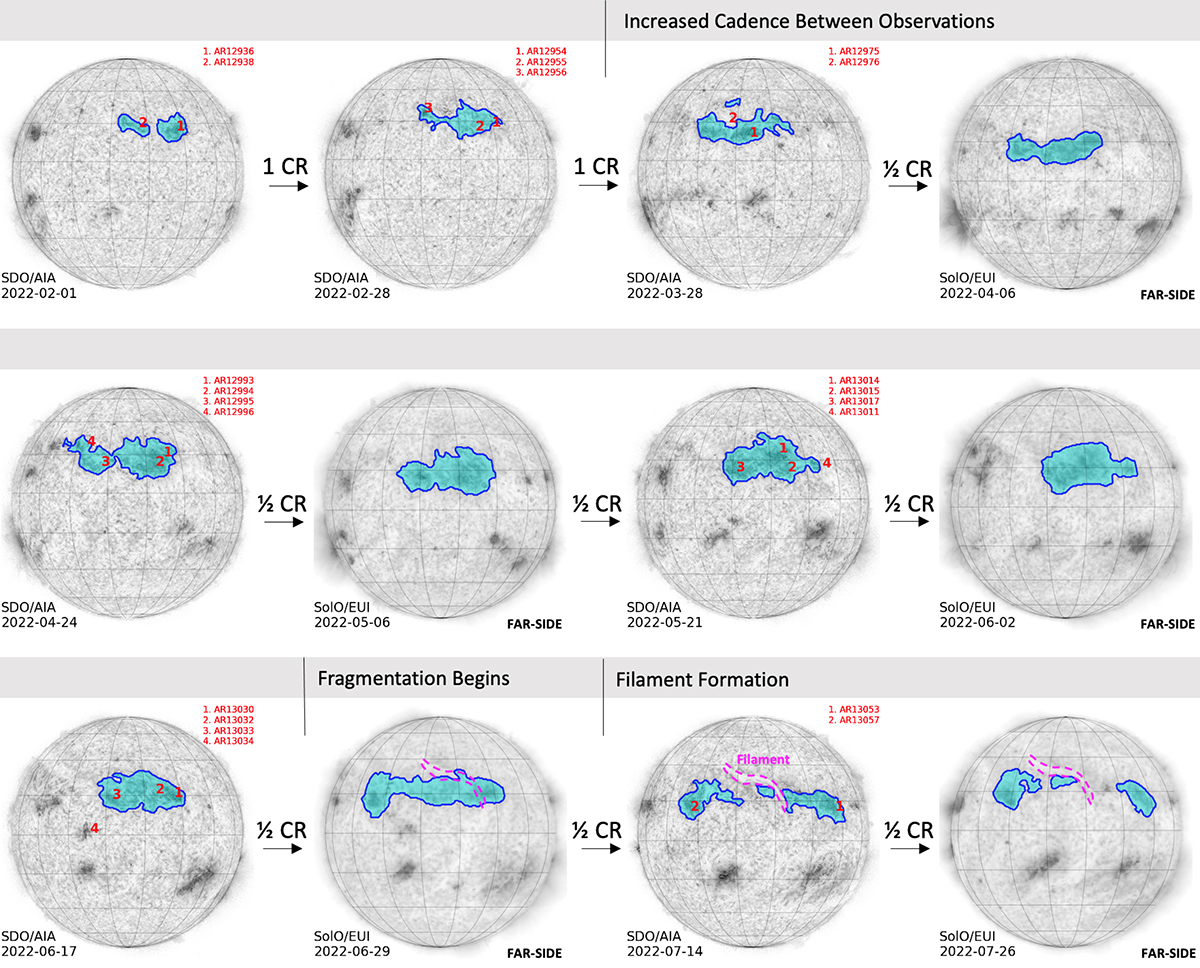
Fig. 4.
Download original image
Timeline of EUV 304 Å observations for the AR nest from February to July 2022 (greyscale). From April onwards, the sequence of full-disk images alternates between AIA and EUI (on the far side of the Sun) with roughly two weeks between each image. Each image is centred on 90° Carrington longitude with the AR nest highlighted using a filled blue contour. When visible from Earth, the NOAA AR numbers for this region are annotated in red. The latitude of Solar Orbiter varied by a few degrees in this sequence, which changes the apparent latitude of the AR nest.
Current usage metrics show cumulative count of Article Views (full-text article views including HTML views, PDF and ePub downloads, according to the available data) and Abstracts Views on Vision4Press platform.
Data correspond to usage on the plateform after 2015. The current usage metrics is available 48-96 hours after online publication and is updated daily on week days.
Initial download of the metrics may take a while.