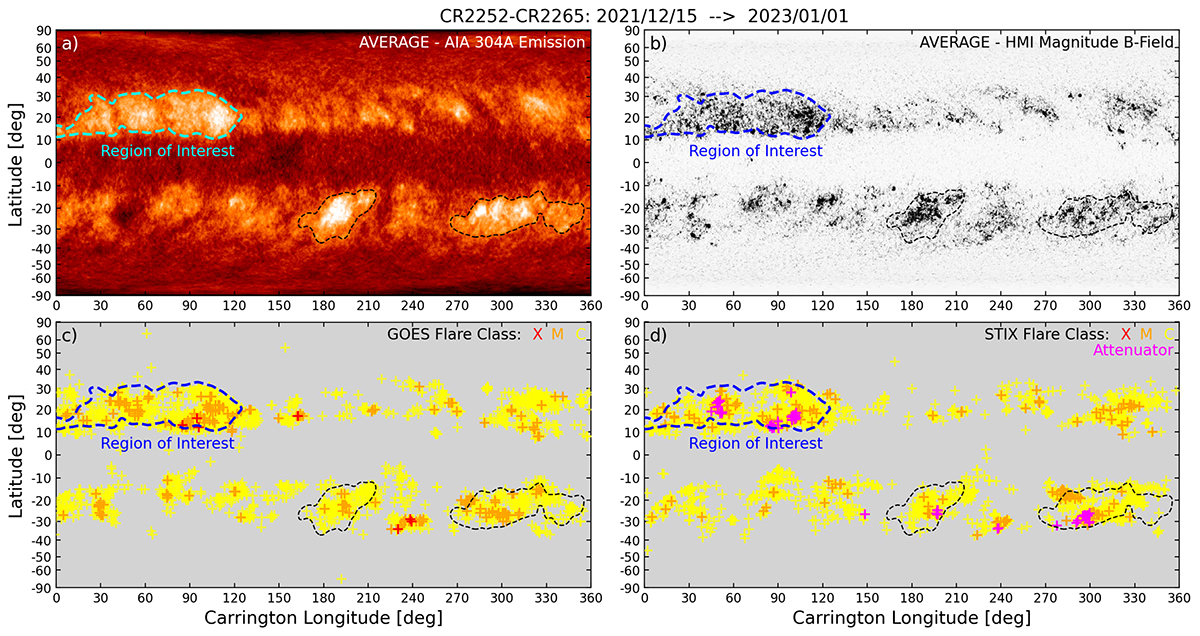
Fig. 2.
Download original image
Distribution of magnetic activity in Carrington coordinates in 2022 (sine latitude grid). Panels (a) and (b): Averaged 304 Å EUV emission and magnetic field magnitude, respectively. The average EUV emission is used to identify hot spots that might be related to AR nests. They are highlighted with a dashed black contour. The region of interest for this study is highlighted with a thicker cyan (or blue) contour. Panels (c) and (d): Comparison of the distribution of solar flares observed by GOES and STIX.
Current usage metrics show cumulative count of Article Views (full-text article views including HTML views, PDF and ePub downloads, according to the available data) and Abstracts Views on Vision4Press platform.
Data correspond to usage on the plateform after 2015. The current usage metrics is available 48-96 hours after online publication and is updated daily on week days.
Initial download of the metrics may take a while.