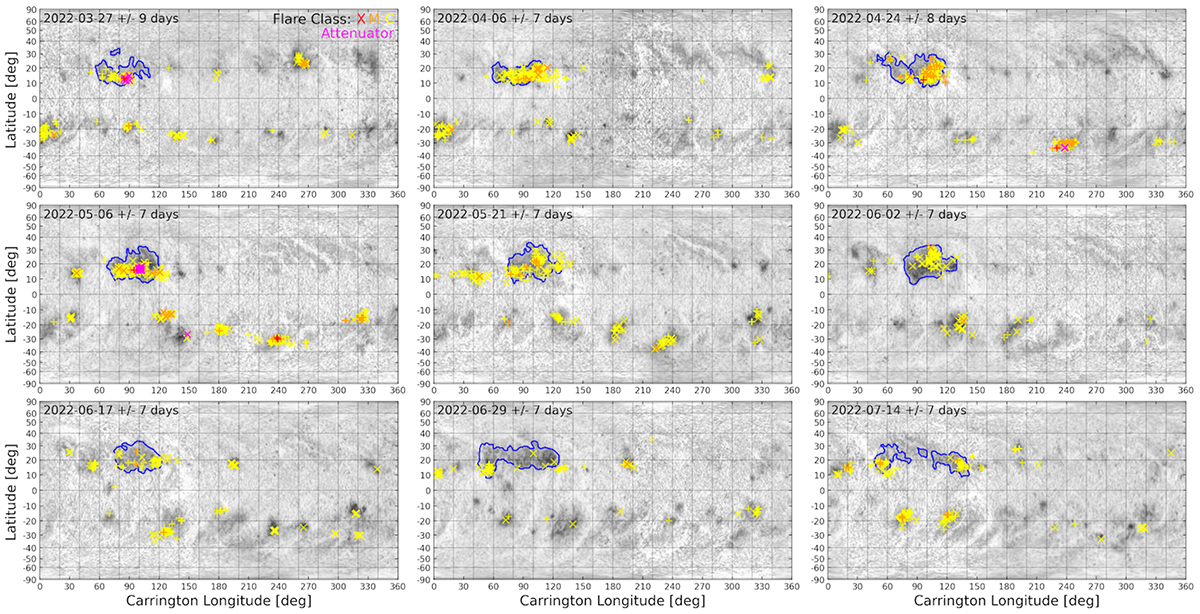
Fig. D.1.
Download original image
Combined EUV 304Å Carrington maps (grey scale) with the location of solar flares observed by GOES and STIX marked with crossed that are coloured by flare class. The AR nest is outlined with a blue contour. This series of maps covers the first period of high activity from the end of March until the fragmentation and filament formation in July.
Current usage metrics show cumulative count of Article Views (full-text article views including HTML views, PDF and ePub downloads, according to the available data) and Abstracts Views on Vision4Press platform.
Data correspond to usage on the plateform after 2015. The current usage metrics is available 48-96 hours after online publication and is updated daily on week days.
Initial download of the metrics may take a while.