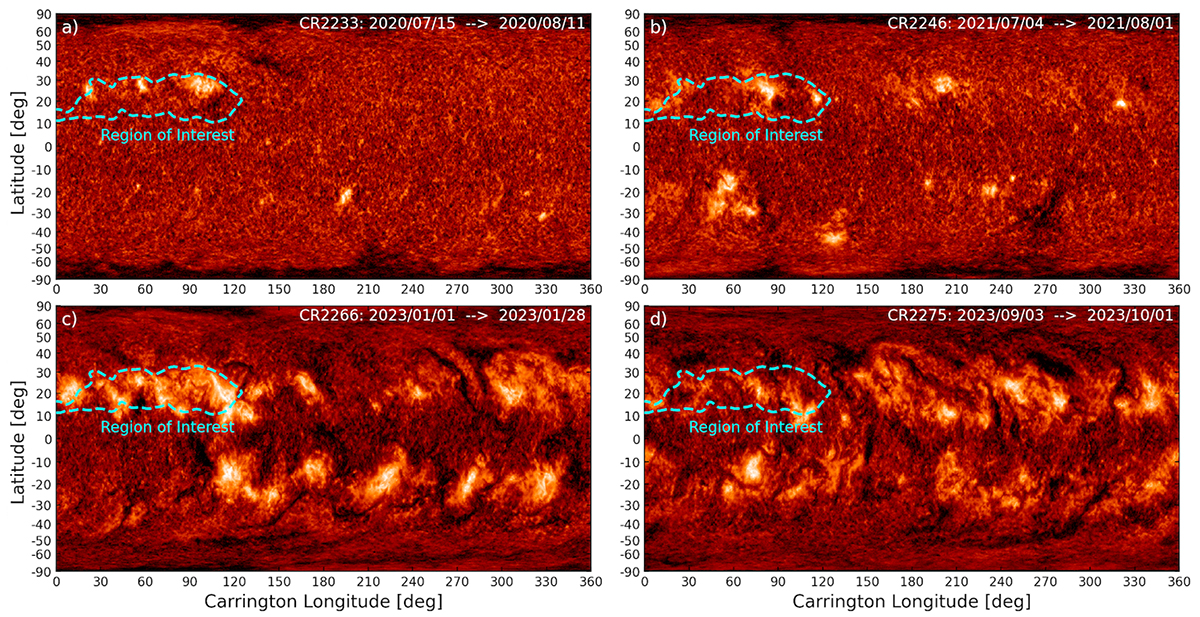
Fig. C.1.
Download original image
Carrington maps of EUV 304Å from AIA highlighting the presence of magnetic activity in the region of interest before and after 2022. Panels (a) and (b) correspond to July-August 2020 and July 2021, respectively. Panels (c) and (d) show activity from the AR nest in 2022 persisting into 2023. The AR nest identified in Fig. 2 is shown with a dashed cyan contour.
Current usage metrics show cumulative count of Article Views (full-text article views including HTML views, PDF and ePub downloads, according to the available data) and Abstracts Views on Vision4Press platform.
Data correspond to usage on the plateform after 2015. The current usage metrics is available 48-96 hours after online publication and is updated daily on week days.
Initial download of the metrics may take a while.