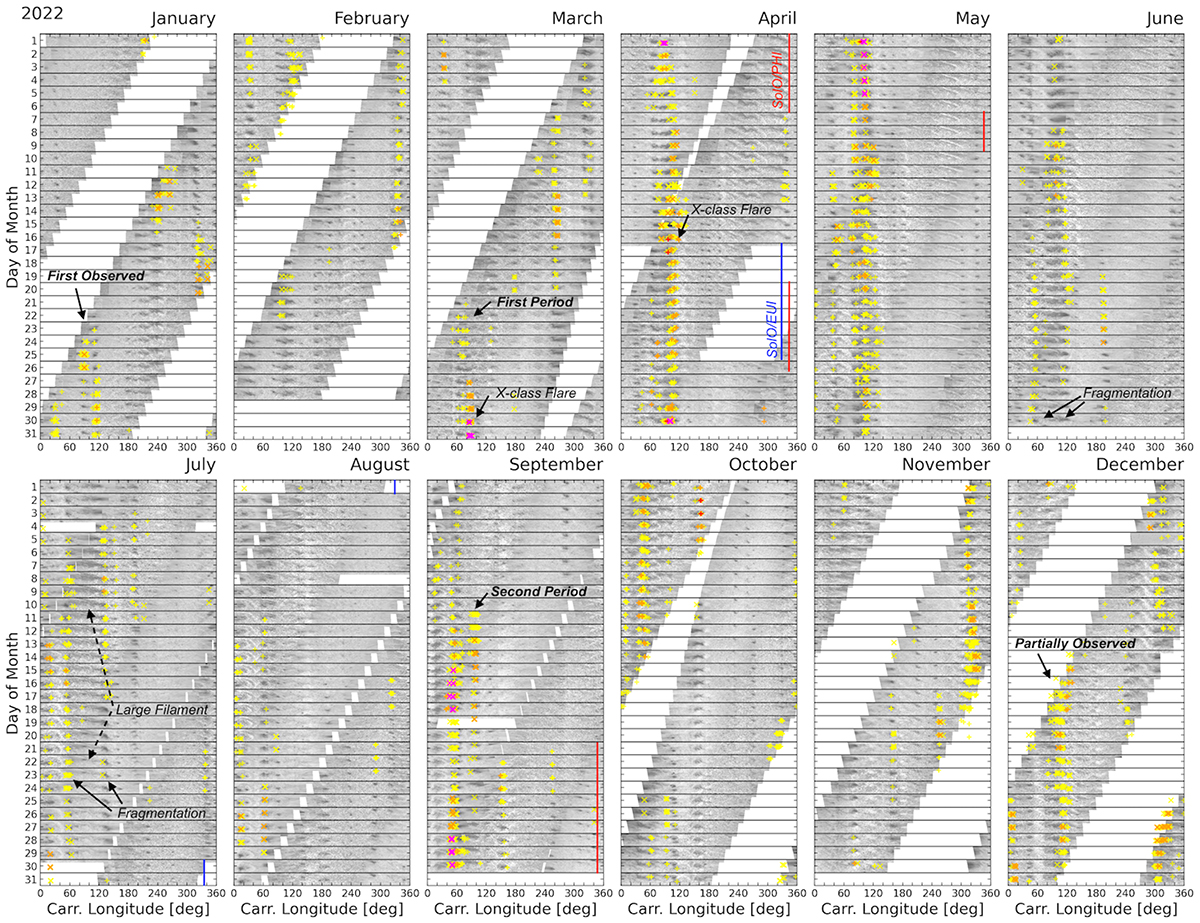
Fig. A.1.
Download original image
Monthly stack-plots of solar activity in the northern hemisphere. EUV 304Å observations using the daily synoptic observations from AIA and EUI are shown in greyscale for context. The location of solar flares observed by GOES and STIX are plotted with coloured markers. The colour corresponds to the GOES flare class of X, M, and C, in red, orange, and yellow, respectively. Magenta markers highlight STIX flares that triggered the attentuator. Red and blue vertical bars highlight observing gaps larger than two days for PHI and EUI, respectively.
Current usage metrics show cumulative count of Article Views (full-text article views including HTML views, PDF and ePub downloads, according to the available data) and Abstracts Views on Vision4Press platform.
Data correspond to usage on the plateform after 2015. The current usage metrics is available 48-96 hours after online publication and is updated daily on week days.
Initial download of the metrics may take a while.