Fig. 6
Download original image
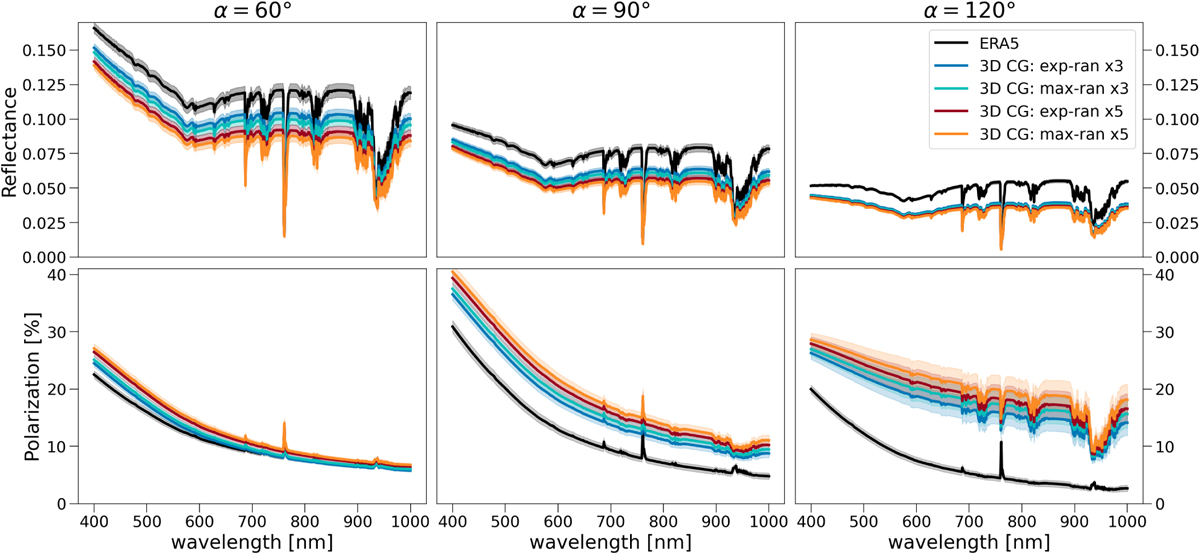
Reflected light (first row) and polarized light (second row) spectra showing the influence of the 3D CG approach applied to the ERA5 reanalysis data for the clouds compared to the ERA5 data themselves (black line). The 3D CG was run assuming different vertical overlap schemes: EXP-RAN and MAX-RAN and different zoom-in factors (×3 and ×5). The different columns refer to spectra at different phase angles α: 60, 90, 120°.
Current usage metrics show cumulative count of Article Views (full-text article views including HTML views, PDF and ePub downloads, according to the available data) and Abstracts Views on Vision4Press platform.
Data correspond to usage on the plateform after 2015. The current usage metrics is available 48-96 hours after online publication and is updated daily on week days.
Initial download of the metrics may take a while.