Fig. 2
Download original image
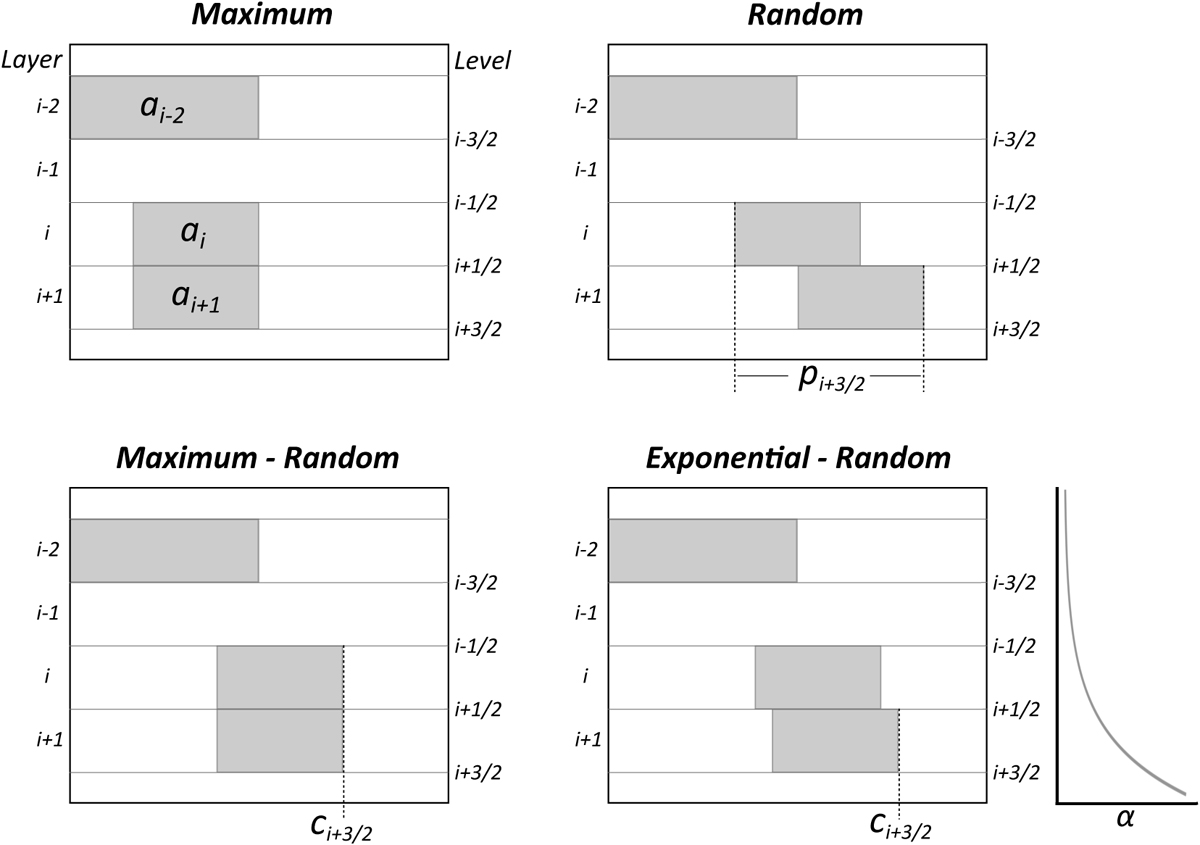
Schematic illustration of four cloud overlap assumptions: maximum, random, maximum-random (MAX-RAN), and exponential-random (EXP-RAN) overlap. The figure also shows the meaning of three important quantities: the cloud cover of a given layer, ai; the pairwise cloud cover pi+1/2; and the cumulative cloud cover ci+1/2. For the EXP-RAN overlap, a schematic illustration of the exponentially decaying α parameter is also included, showing how it decreases with altitude as the separation between layers increases.
Current usage metrics show cumulative count of Article Views (full-text article views including HTML views, PDF and ePub downloads, according to the available data) and Abstracts Views on Vision4Press platform.
Data correspond to usage on the plateform after 2015. The current usage metrics is available 48-96 hours after online publication and is updated daily on week days.
Initial download of the metrics may take a while.