Fig. C.1
Download original image
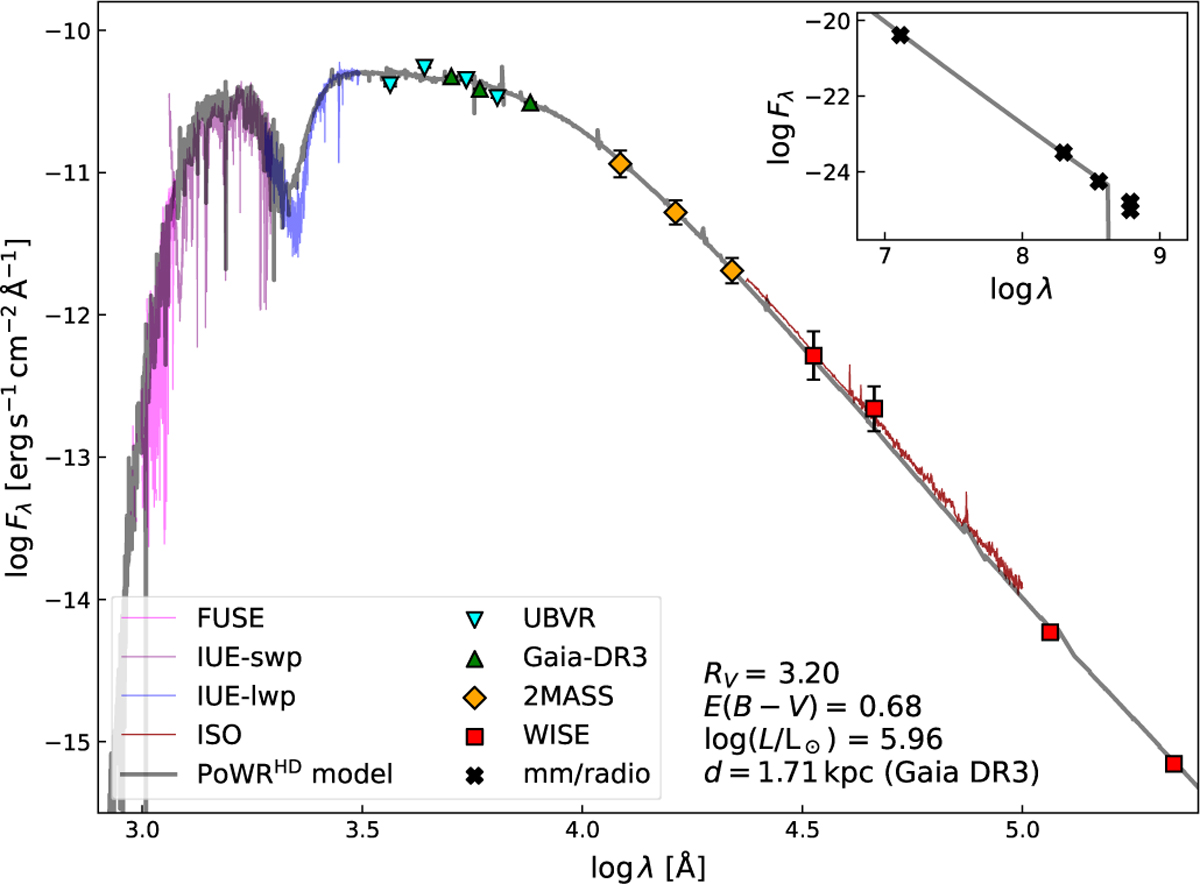
Comparison of the hydrodynamically consistent model of ζ1 Sco (gray line) with the star’s SED and flux-calibrated UV and mid- IR spectra. The UV spectra are retrieved from FUSE and IUE (fuchsia, purple, and blue lines). The mid-IR spectrum was obtained with ISO (brown line). The cyan triangles are the flux points of the UBVI photometry. The orange diamonds are from the 2MASS JHK photometry, and the red squares are from WISE mid- and far-IR photometry. The inlet plot shows the millimeter/radio regime; the black crosses are the flux points obtained with the Very Large Array (VLA). The truncation in the synthetic spectrum is an artifact of the code output. See Appendix E.
Current usage metrics show cumulative count of Article Views (full-text article views including HTML views, PDF and ePub downloads, according to the available data) and Abstracts Views on Vision4Press platform.
Data correspond to usage on the plateform after 2015. The current usage metrics is available 48-96 hours after online publication and is updated daily on week days.
Initial download of the metrics may take a while.