Fig. 13
Download original image
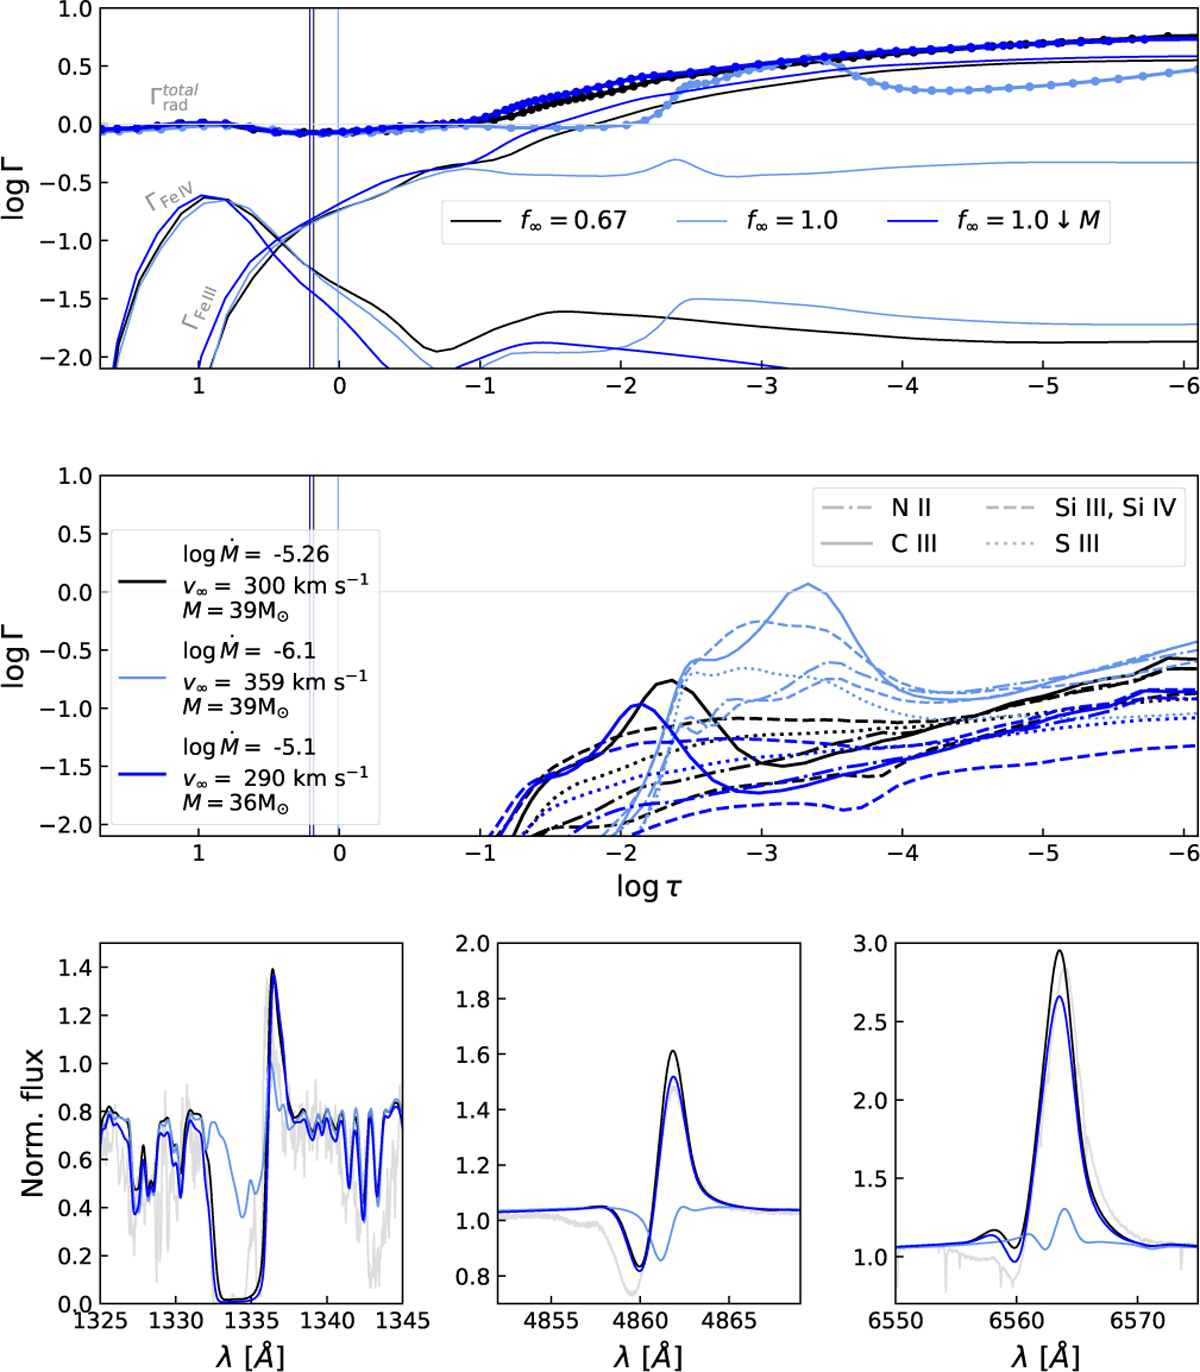
Degeneracy between clumping and stellar mass. In all panels, the black lines indicate the final model, the light blue lines the model without clumping, and the dark blue lines the model without clumping with a reduced mass. Upper panel: radiative acceleration vs. Rosseland optical depth. The total radiative acceleration, ![]() , is indicated by the thick line with dots, and the thinner lines below indicate the contribution of Fe III and Fe IV. The thin vertical lines indicate the position of the critical points. Middle panel: same as the upper panes but showing the contribution of the main ions of C, N, S, and Si. Lower panels: comparison between the models’ output spectra. Mass-loss rate units are M⊙ yr−-1.
, is indicated by the thick line with dots, and the thinner lines below indicate the contribution of Fe III and Fe IV. The thin vertical lines indicate the position of the critical points. Middle panel: same as the upper panes but showing the contribution of the main ions of C, N, S, and Si. Lower panels: comparison between the models’ output spectra. Mass-loss rate units are M⊙ yr−-1.
Current usage metrics show cumulative count of Article Views (full-text article views including HTML views, PDF and ePub downloads, according to the available data) and Abstracts Views on Vision4Press platform.
Data correspond to usage on the plateform after 2015. The current usage metrics is available 48-96 hours after online publication and is updated daily on week days.
Initial download of the metrics may take a while.