Fig. 11
Download original image
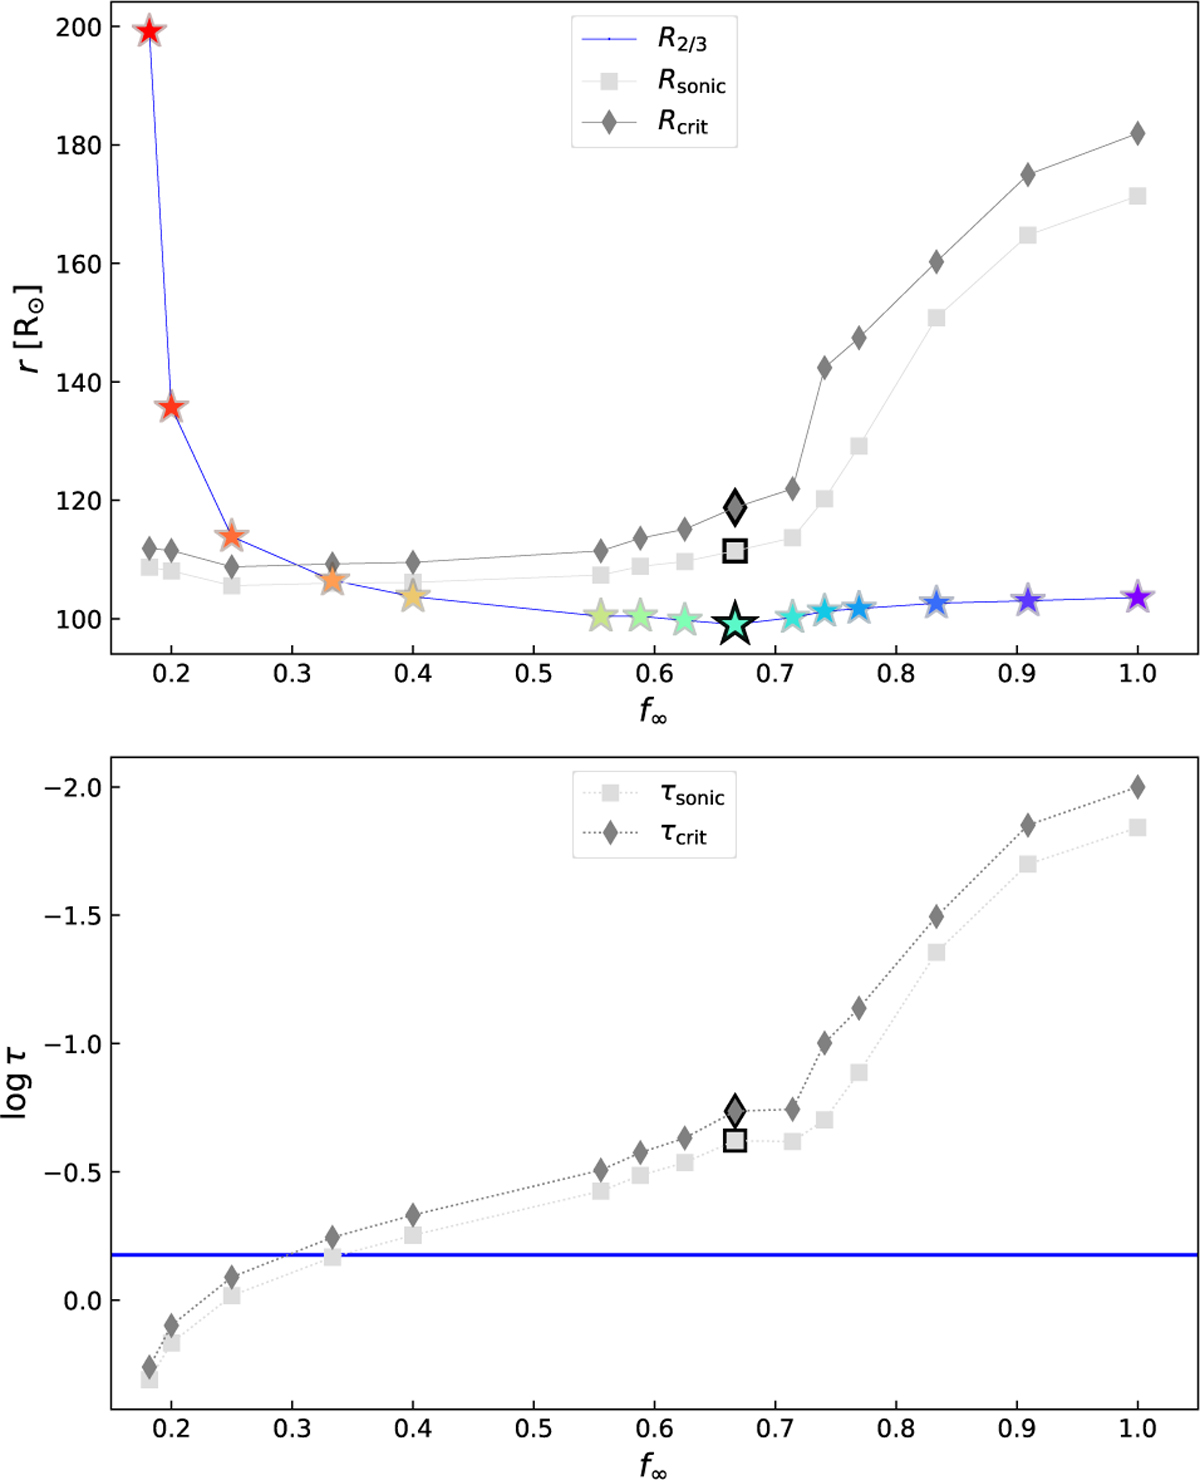
Upper panel: changes in the position of the critical (Rcrit; dark gray diamonds), sonic (Rsonίc; light gray squares), and photospheric (R2/3; colored stars connected by the blue line) radii as a function of different values of the clumping volume filling factor, f⊙ The bold black symbols indicate the best-fit model. Lower panel: same as the upper panel but showing the sonic and critical points in terms of the Rosseland-mean optical depth, τ. The blue horizontal line indicates the photosphere, where τ = 2/3.
Current usage metrics show cumulative count of Article Views (full-text article views including HTML views, PDF and ePub downloads, according to the available data) and Abstracts Views on Vision4Press platform.
Data correspond to usage on the plateform after 2015. The current usage metrics is available 48-96 hours after online publication and is updated daily on week days.
Initial download of the metrics may take a while.