Fig. 6
Download original image
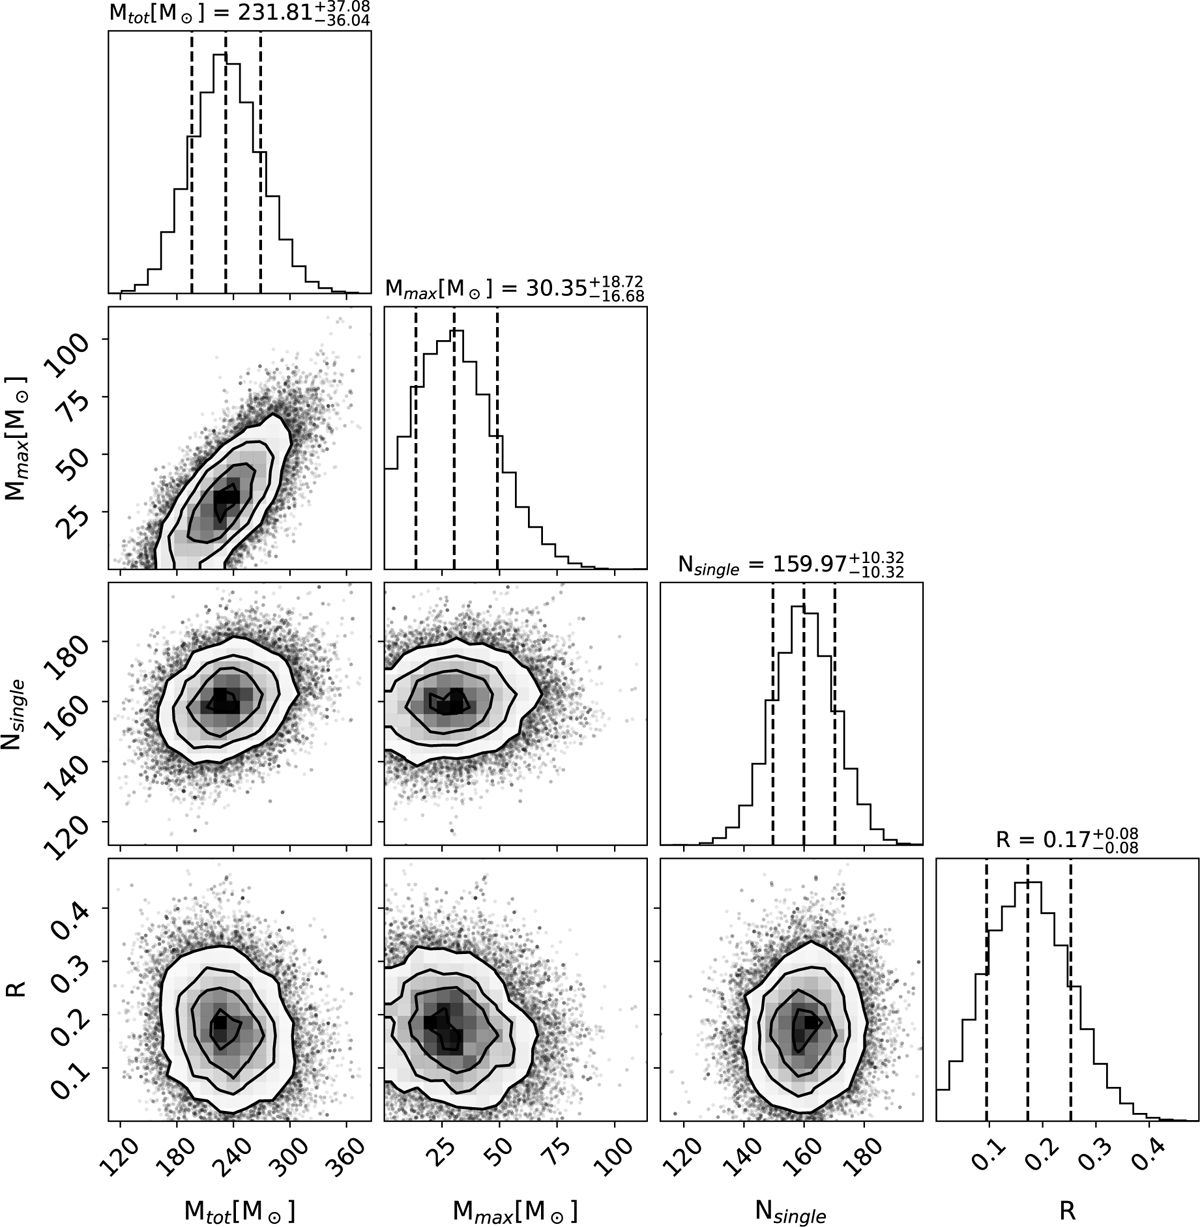
EMCEE parameter sampling of the simulated clusters with an initial binary fraction of 0% at 89 Myr. The first column shows the total initial mass of the simulated cluster, the second column depicts the mass of the most massive star in the simulation, and the last column represents the radius of the layered structure. The remaining columns represent the number of single stars, and the vertical dashed black lines indicate the one standard deviation spread at the 16th, 50th and 84th percentiles.
Current usage metrics show cumulative count of Article Views (full-text article views including HTML views, PDF and ePub downloads, according to the available data) and Abstracts Views on Vision4Press platform.
Data correspond to usage on the plateform after 2015. The current usage metrics is available 48-96 hours after online publication and is updated daily on week days.
Initial download of the metrics may take a while.