Open Access
Fig. 4
Download original image
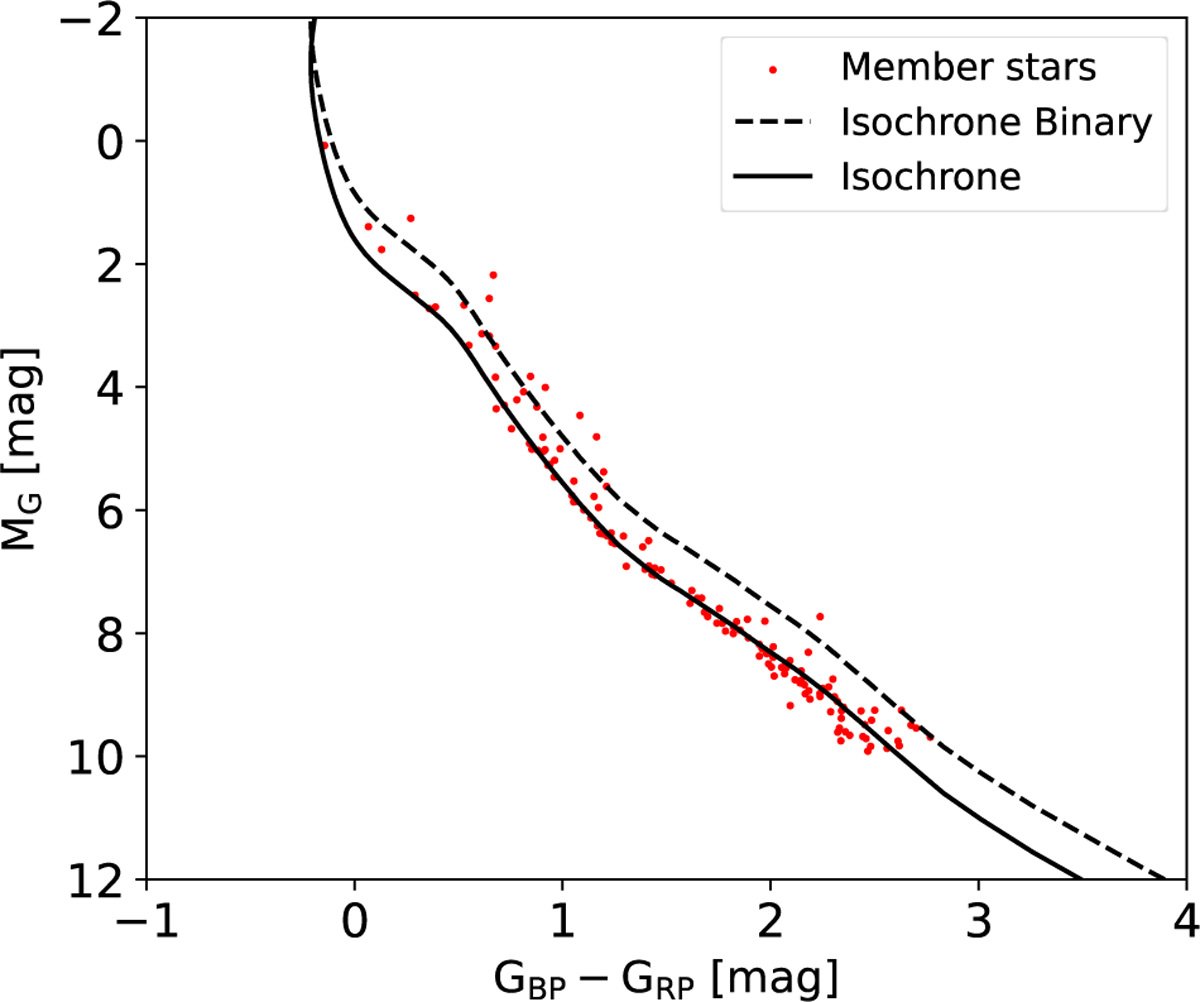
Plot for the CMD of the cluster OCSN 125. The black solid line and dotted line represent the best-fit isochrones corresponding to the single stars and the equal mass-ratio binary stars, respectively. The red points mark the member stars of OCSN 125.
Current usage metrics show cumulative count of Article Views (full-text article views including HTML views, PDF and ePub downloads, according to the available data) and Abstracts Views on Vision4Press platform.
Data correspond to usage on the plateform after 2015. The current usage metrics is available 48-96 hours after online publication and is updated daily on week days.
Initial download of the metrics may take a while.