Open Access
Fig. 1
Download original image
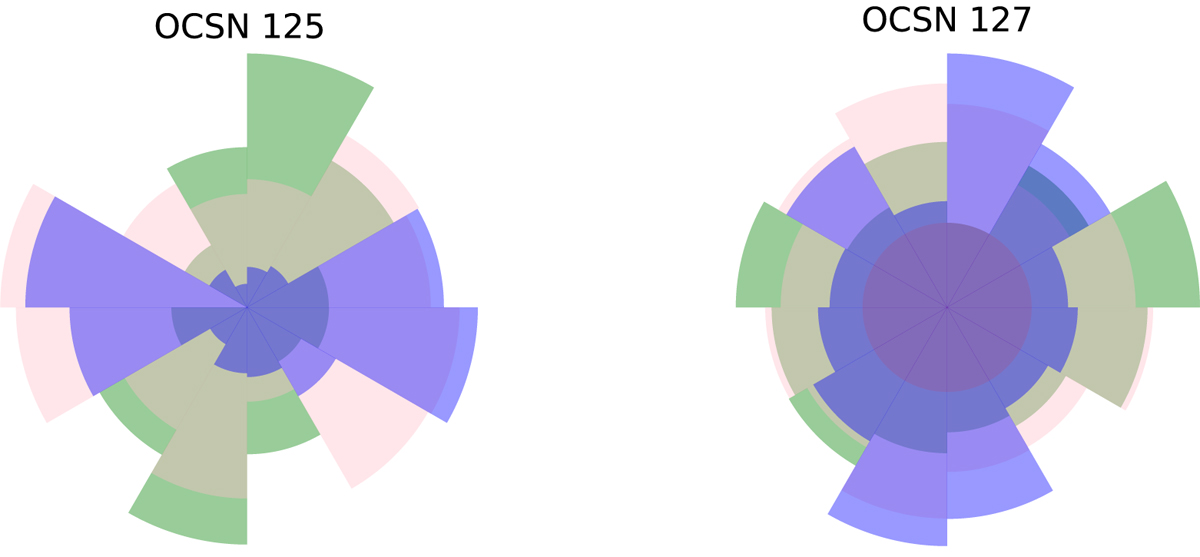
Rose map of OCSN 125 and OCSN 127 obtained by superposition in 3D space, with the X-Y plane (green), X-Z plane (pink), and Y-Z plane (blue). The left subplot exhibits the absence of a layered structure, and the right subplot shows a layered structure.
Current usage metrics show cumulative count of Article Views (full-text article views including HTML views, PDF and ePub downloads, according to the available data) and Abstracts Views on Vision4Press platform.
Data correspond to usage on the plateform after 2015. The current usage metrics is available 48-96 hours after online publication and is updated daily on week days.
Initial download of the metrics may take a while.