Fig. 5.
Download original image
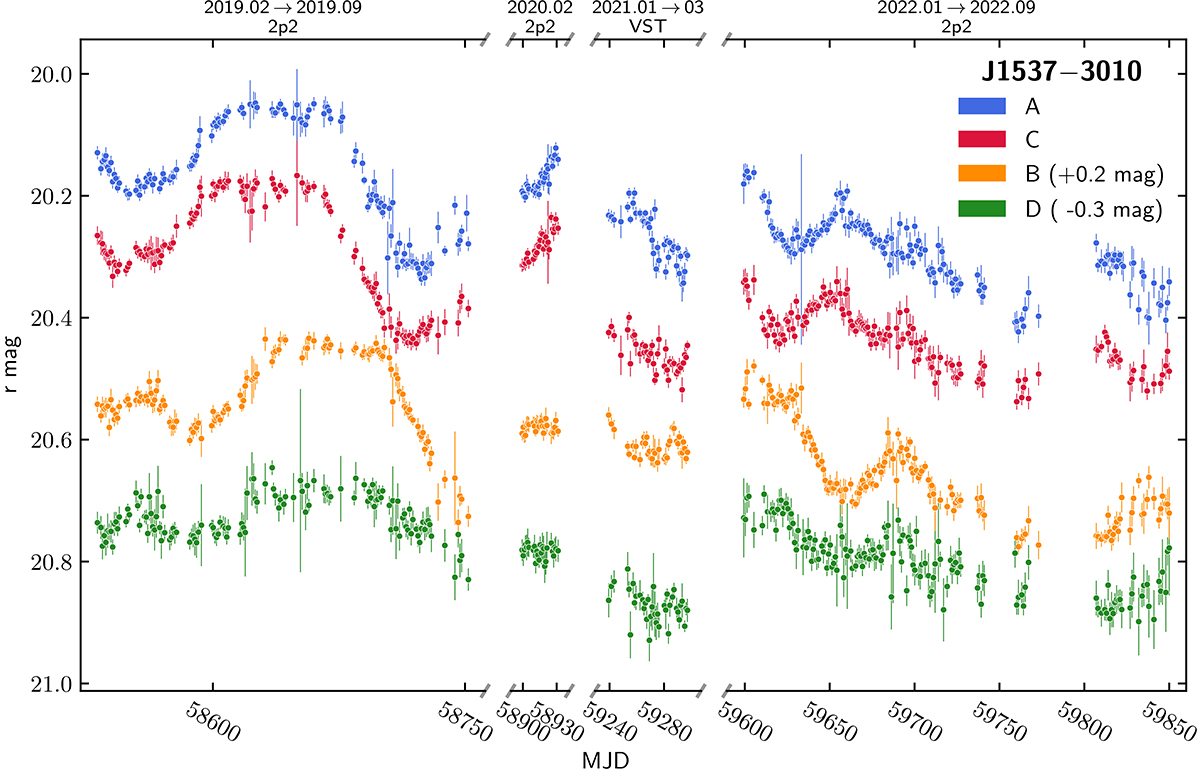
Light curves extracted from the imaging data of J1537−3010 (labelling of the lensed images in Fig. 6), monitored at both observatories and spanning four seasons, with the 2020 and 2021 ones shortened by the COVID-19 pandemic. Note that the empty season gaps are cut from the plot. A magnitude offset was added to the individual curves as is indicated in the legend, for display purposes.
Current usage metrics show cumulative count of Article Views (full-text article views including HTML views, PDF and ePub downloads, according to the available data) and Abstracts Views on Vision4Press platform.
Data correspond to usage on the plateform after 2015. The current usage metrics is available 48-96 hours after online publication and is updated daily on week days.
Initial download of the metrics may take a while.