Fig. 4.
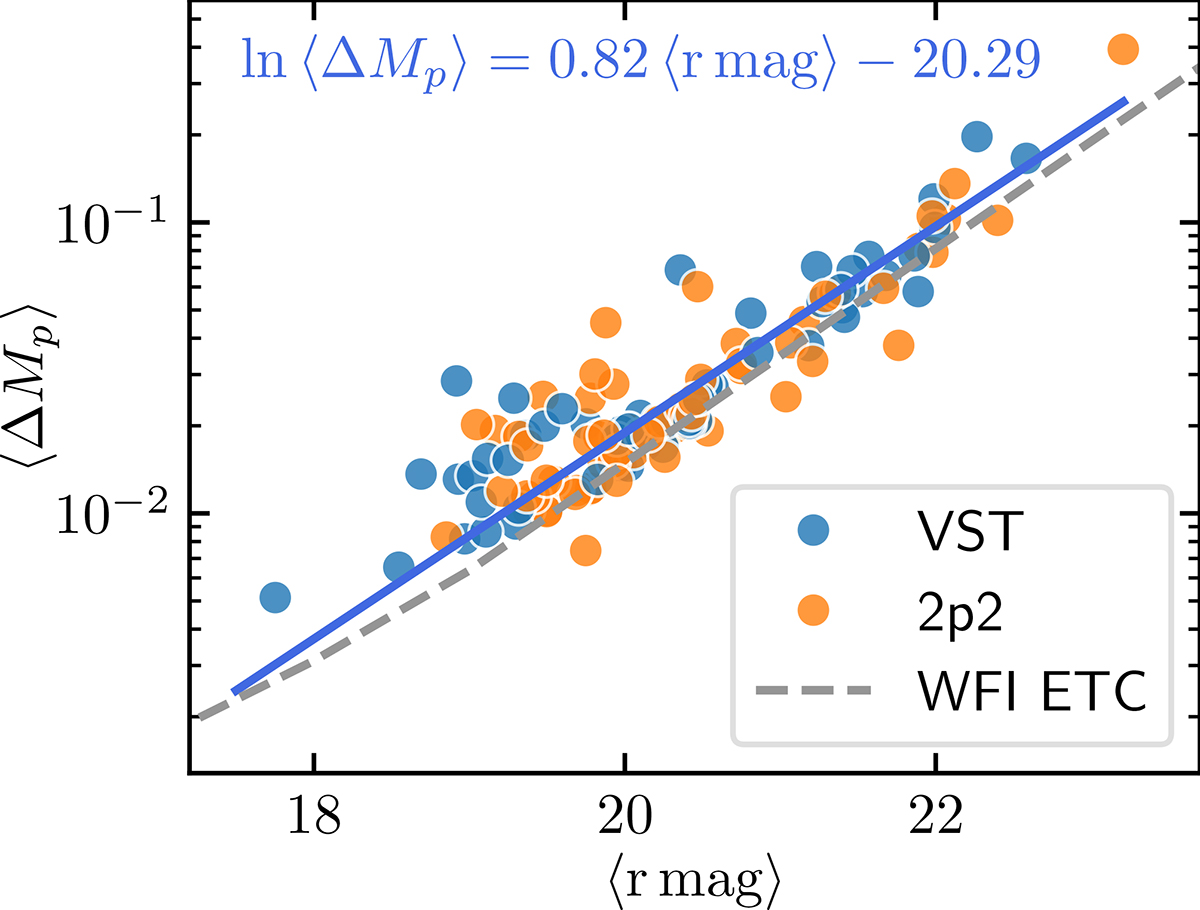
Download original image
Average nightly scatter of the measured lensed-image magnitudes, plotted against the mean magnitude of the lensed image at hand. The scatters are empirical, and thereby include photon noise, read noise, deblending errors, and normalisation errors between frames. The dashed line is the noise estimate given by the ESO/WFI exposure time calculator (ETC), for a point source in the r band in good seeing conditions (1″), average moon illumination, and 320 second exposures. The similarity between idealised and empirical errors indicates that our procedure has an excellent deblending performance. For reference, the line fit in blue indicates the measured photometric performance given the magnitude of a given target point source.
Current usage metrics show cumulative count of Article Views (full-text article views including HTML views, PDF and ePub downloads, according to the available data) and Abstracts Views on Vision4Press platform.
Data correspond to usage on the plateform after 2015. The current usage metrics is available 48-96 hours after online publication and is updated daily on week days.
Initial download of the metrics may take a while.