Fig. 9.
Download original image
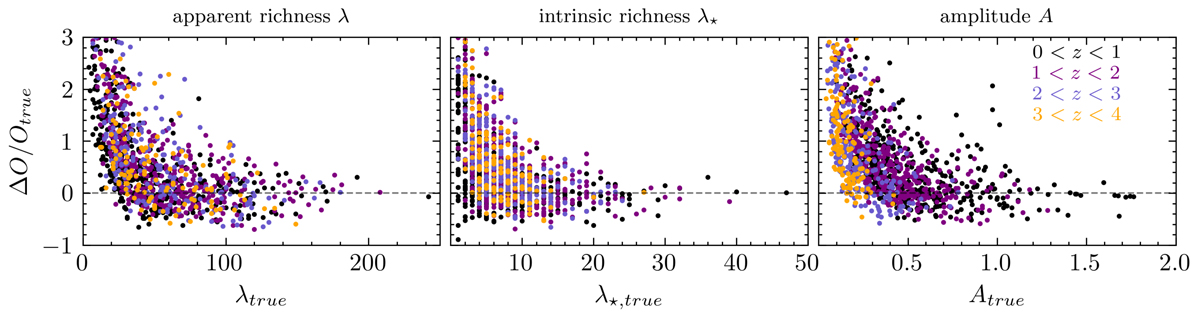
Relative scatter of the three observables (O, i.e., λ, λ⋆ and A, from left to right) between the detected observables, Odet, and the true observables as in the mocks, (Otrue). The scatter is here expressed by ΔO = Odet − Otrue. Different colors mark different redshift bins as indicated in the plot on the right. Points with a scatter larger than 3.0 and the detection in Fig. 1 (which is much richer than the rest of the sample) are not shown for better visualization of scatters and biases.
Current usage metrics show cumulative count of Article Views (full-text article views including HTML views, PDF and ePub downloads, according to the available data) and Abstracts Views on Vision4Press platform.
Data correspond to usage on the plateform after 2015. The current usage metrics is available 48-96 hours after online publication and is updated daily on week days.
Initial download of the metrics may take a while.