Fig. 8.
Download original image
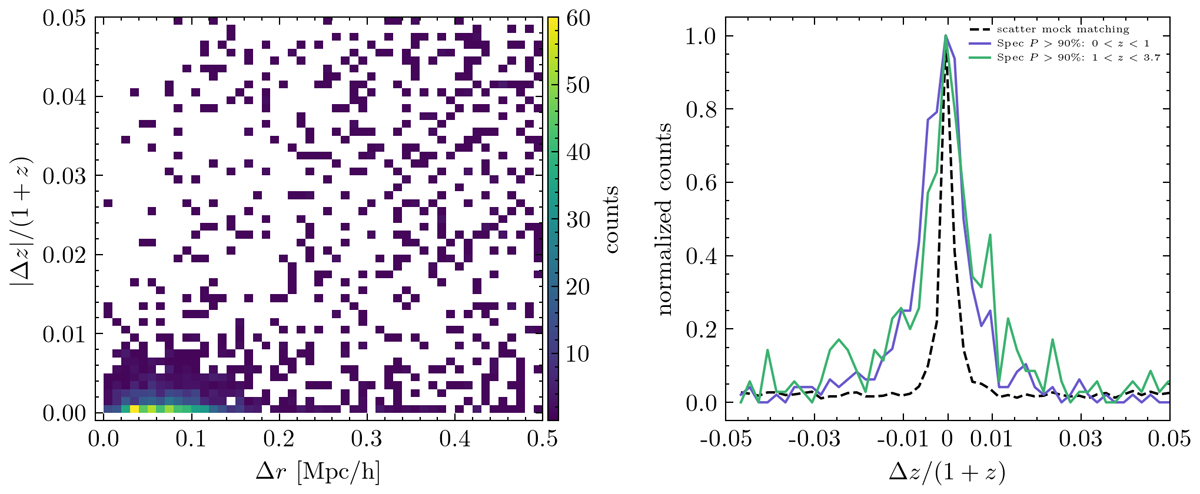
Left panel: Distribution of matched detections in the redshift scatter, |Δz|/(1 + z) – radial separation, Δr [Mpc/h] plane for an initial matching with maximum separation dz = 0.05(1 + z) and dr = 0.5 Mpc/h. Most of the matched detections are concentrated in the rectangular area at Δr < 0.2 Mpc/h and at |Δz|/(1 + z) < 0.01. Right panel: Distribution of the redshift scatter for the mock matching (dashed black line) compared to the scatter between group photo-z and group spec-z estimated as the mean of spec-members with P > 90%, in two intervals of redshift (solid purple and green lines). The distributions are normalized to 1.0 to better compare scatters.
Current usage metrics show cumulative count of Article Views (full-text article views including HTML views, PDF and ePub downloads, according to the available data) and Abstracts Views on Vision4Press platform.
Data correspond to usage on the plateform after 2015. The current usage metrics is available 48-96 hours after online publication and is updated daily on week days.
Initial download of the metrics may take a while.