Fig. 8
Download original image
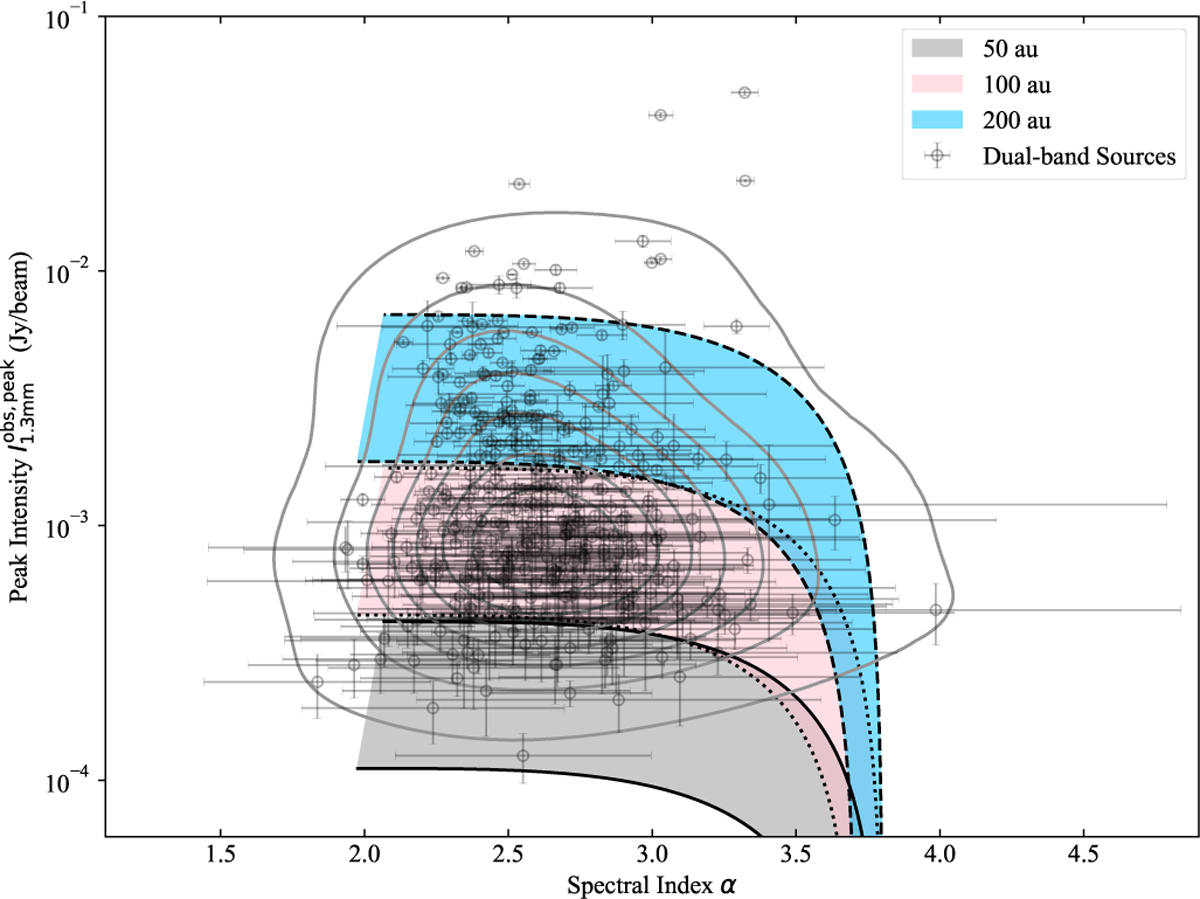
Observed peak flux, ![]() , versus dual-band spectral index, α. The black circles with error bars show the dual-band detections, of which the KDE is shown in gray contours. The self-consistent dust model with micron-sized (amax = 0.01 mm) dust grains (Liu 2019) are shown with shaded regions that cover a temperature range of 6–48 K. The blue, pink, and gray colors represent beam diluted class 0/I YSOs with FWHM sizes of 50, 100, and 200 au, respectively.
, versus dual-band spectral index, α. The black circles with error bars show the dual-band detections, of which the KDE is shown in gray contours. The self-consistent dust model with micron-sized (amax = 0.01 mm) dust grains (Liu 2019) are shown with shaded regions that cover a temperature range of 6–48 K. The blue, pink, and gray colors represent beam diluted class 0/I YSOs with FWHM sizes of 50, 100, and 200 au, respectively.
Current usage metrics show cumulative count of Article Views (full-text article views including HTML views, PDF and ePub downloads, according to the available data) and Abstracts Views on Vision4Press platform.
Data correspond to usage on the plateform after 2015. The current usage metrics is available 48-96 hours after online publication and is updated daily on week days.
Initial download of the metrics may take a while.