Fig. 6
Download original image
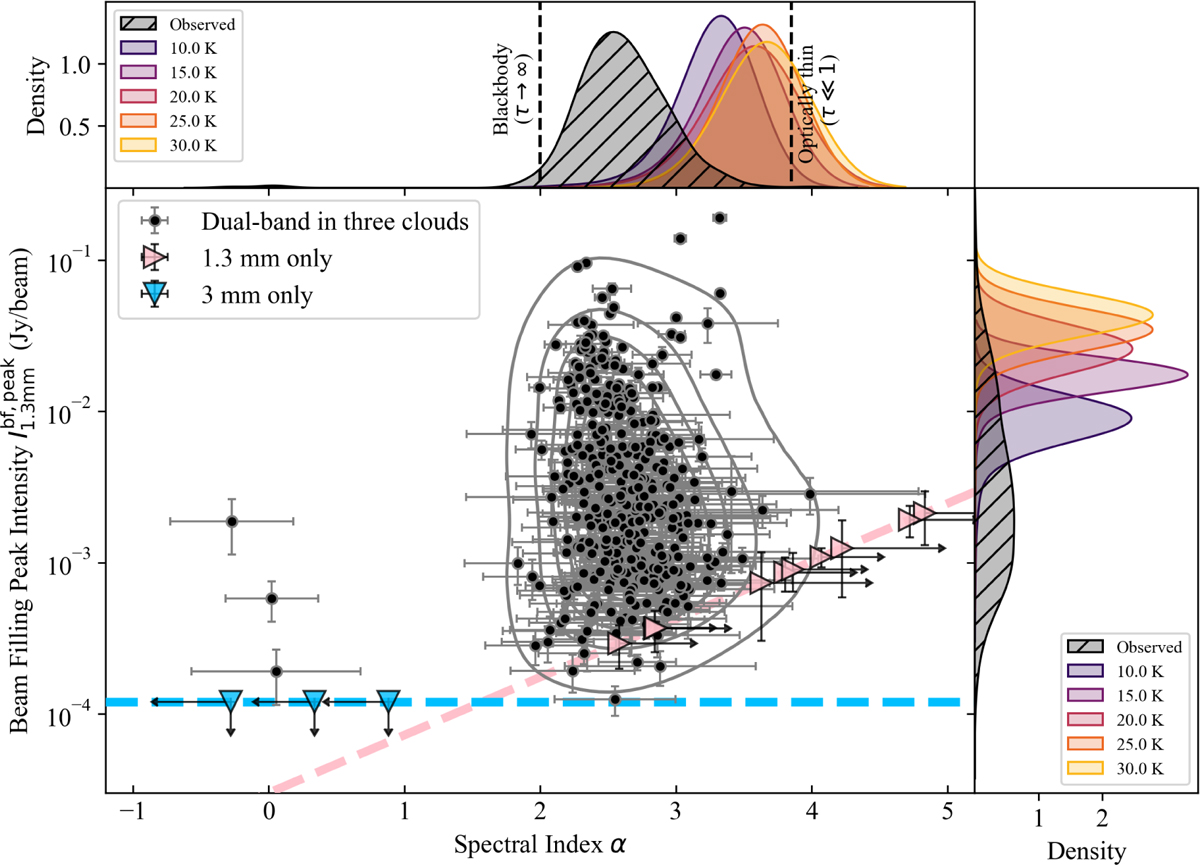
Beam-filling peak intensity at 1.3 mm ![]() versus dual-band spectral index (α). The black circles with error bars show the dual-band detections in the common-beam images. Their KDE is outlined by gray contours. The dashed blue and pink lines show the 3σ detection limits at 1.3 and 3 mm, respectively. The triangles in corresponding colors show those only detected in individual bands. Top: KDE of observed spectral index shown in gray shade. Two special cases including optically thin (α ≃ 3.8) and blackbody (α = 2) emission are marked by vertical dashed black lines. The colored KDEs represent predicted α values from modified blackbody (MBB) emission. Right: observed
versus dual-band spectral index (α). The black circles with error bars show the dual-band detections in the common-beam images. Their KDE is outlined by gray contours. The dashed blue and pink lines show the 3σ detection limits at 1.3 and 3 mm, respectively. The triangles in corresponding colors show those only detected in individual bands. Top: KDE of observed spectral index shown in gray shade. Two special cases including optically thin (α ≃ 3.8) and blackbody (α = 2) emission are marked by vertical dashed black lines. The colored KDEs represent predicted α values from modified blackbody (MBB) emission. Right: observed ![]() is shown in gray shade. The predicted
is shown in gray shade. The predicted ![]() from the MBB emission is given in colored KDEs.
from the MBB emission is given in colored KDEs.
Current usage metrics show cumulative count of Article Views (full-text article views including HTML views, PDF and ePub downloads, according to the available data) and Abstracts Views on Vision4Press platform.
Data correspond to usage on the plateform after 2015. The current usage metrics is available 48-96 hours after online publication and is updated daily on week days.
Initial download of the metrics may take a while.