Fig. 5
Download original image
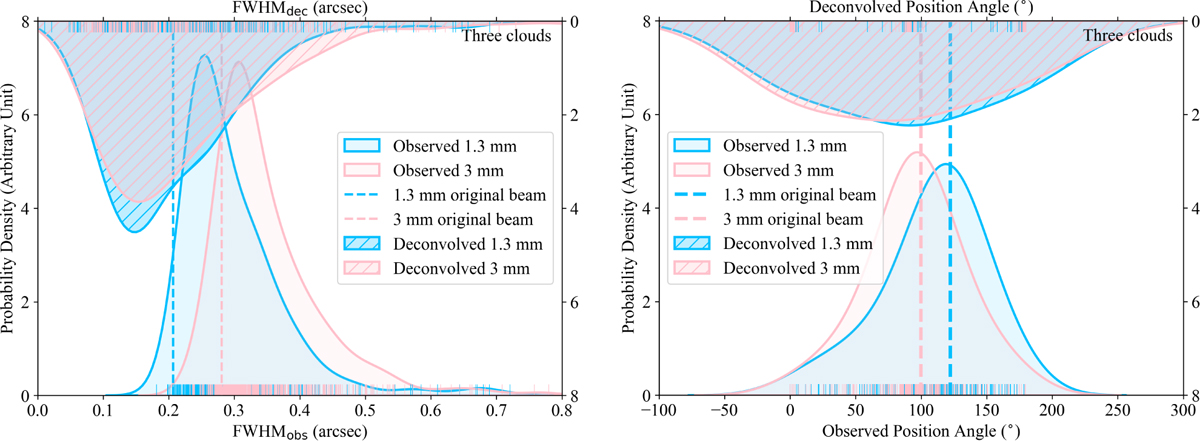
Left: probability distribution of the geometric mean source size FWHM directly measured from observations (FWHMobs) and deconvolved from observations (FWHMdec), shown by KDE. FWHMobs and FWHMdec are presented at the bottom and the top, respectively. Right: probability distributions of measured and deconvolved position angle are shown by KDE at the bottom and the top, respectively. The blue and pink colors represent the 1.3 and 3 mm, respectively. The vertical dashed lines represent the beam sizes and position angles. Both panels show the dbcat measurements from all the three clouds.
Current usage metrics show cumulative count of Article Views (full-text article views including HTML views, PDF and ePub downloads, according to the available data) and Abstracts Views on Vision4Press platform.
Data correspond to usage on the plateform after 2015. The current usage metrics is available 48-96 hours after online publication and is updated daily on week days.
Initial download of the metrics may take a while.