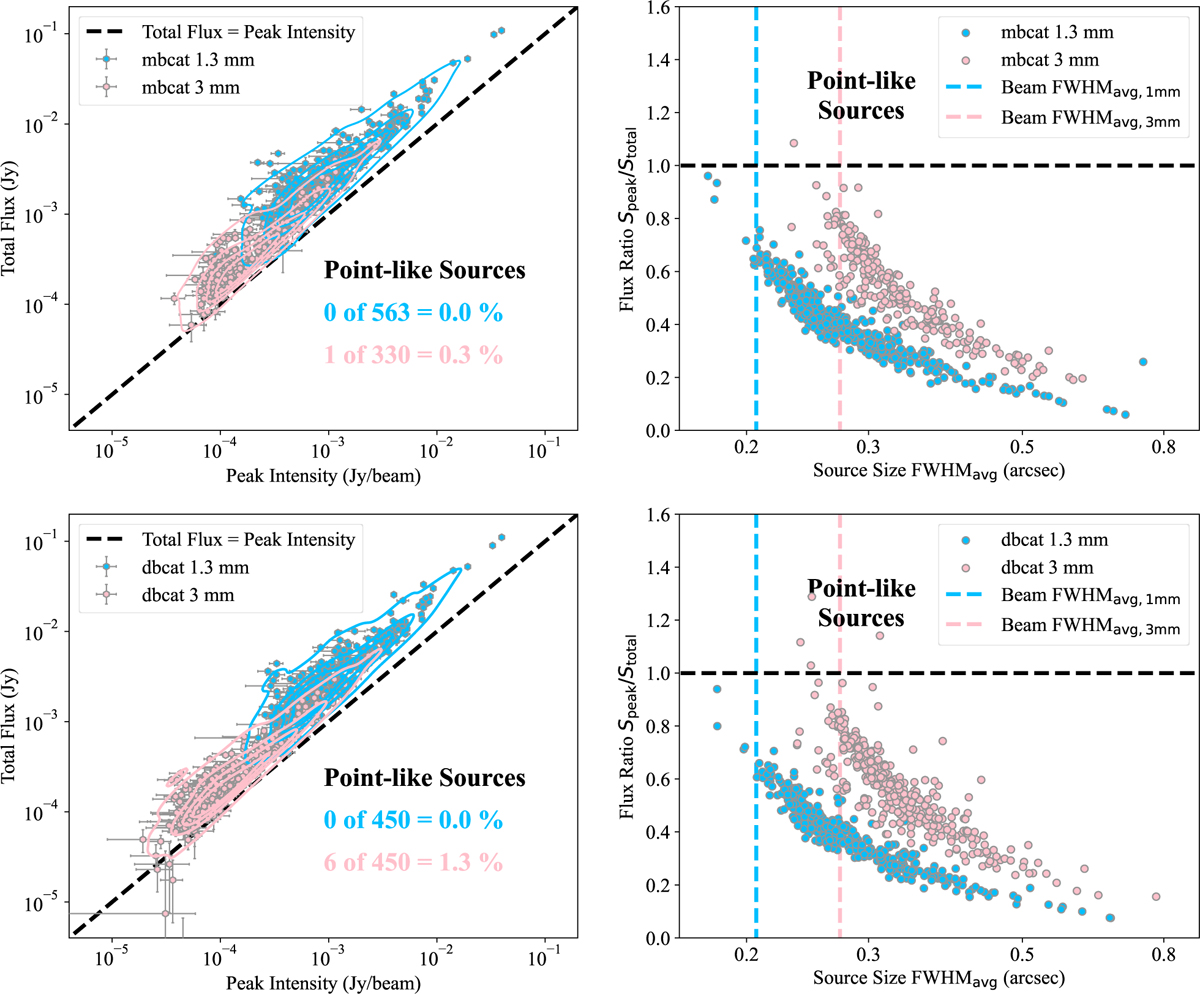
Fig. 4
Download original image
Left: measured total flux versus peak flux shown by KDE (contours). Right: ratio of the flux per beam at the brightest pixel to the total integrated flux (Speak/Stotal) versus source size FWHMavg. The blue and pink data points show the 1.3 and 3 mm sources respectively. The dashed black lines mark where peak intensities equal total fluxes, i.e., true point-like sources. The dashed blue and pink lines mark the beam size of 1.3 and 3 mm observations, respectively. The top and bottom panels show the sources from mbcat and dbcat, respectively.
Current usage metrics show cumulative count of Article Views (full-text article views including HTML views, PDF and ePub downloads, according to the available data) and Abstracts Views on Vision4Press platform.
Data correspond to usage on the plateform after 2015. The current usage metrics is available 48-96 hours after online publication and is updated daily on week days.
Initial download of the metrics may take a while.