Fig. G.1
Download original image
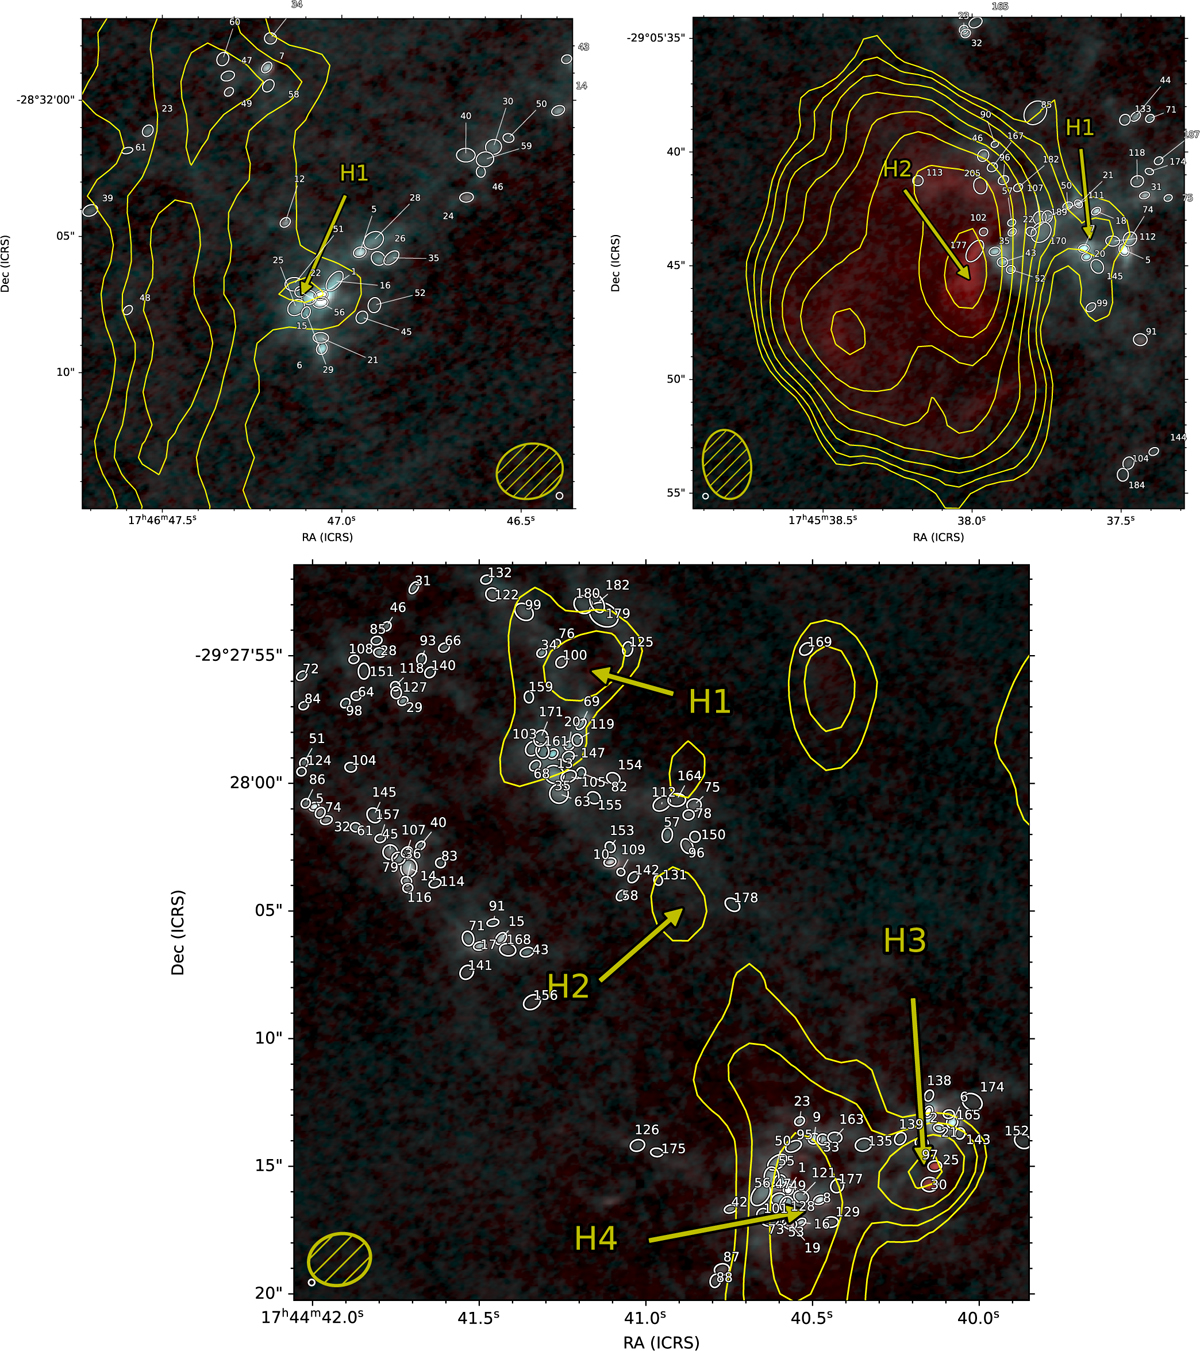
Cross-matching JVLA 1.3 cm emission with dbcat. The background color map shows the ALMA 1.3 mm (cyan) and 3 mm (red) continuum emission. The overlaid yellow contours are JVLA 1.3 cm continuum emission. For the the 20 km s−1 cloud, the contour levels are 0.5, 0.8, 1.3, 2.1, 3.4, 5.5, 8.9, 14.4 mJy beam−1. For the cloud e, they are 0.105, 0.210, 0.315 mJy beam−1. For the Sgr C, they are 0.25, 0.50, 1.0, 2.0 mJy beam−1. All the identified UCHII region candidates are marked with “H”s followed by ID numbers.
Current usage metrics show cumulative count of Article Views (full-text article views including HTML views, PDF and ePub downloads, according to the available data) and Abstracts Views on Vision4Press platform.
Data correspond to usage on the plateform after 2015. The current usage metrics is available 48-96 hours after online publication and is updated daily on week days.
Initial download of the metrics may take a while.