Fig. D.1
Download original image
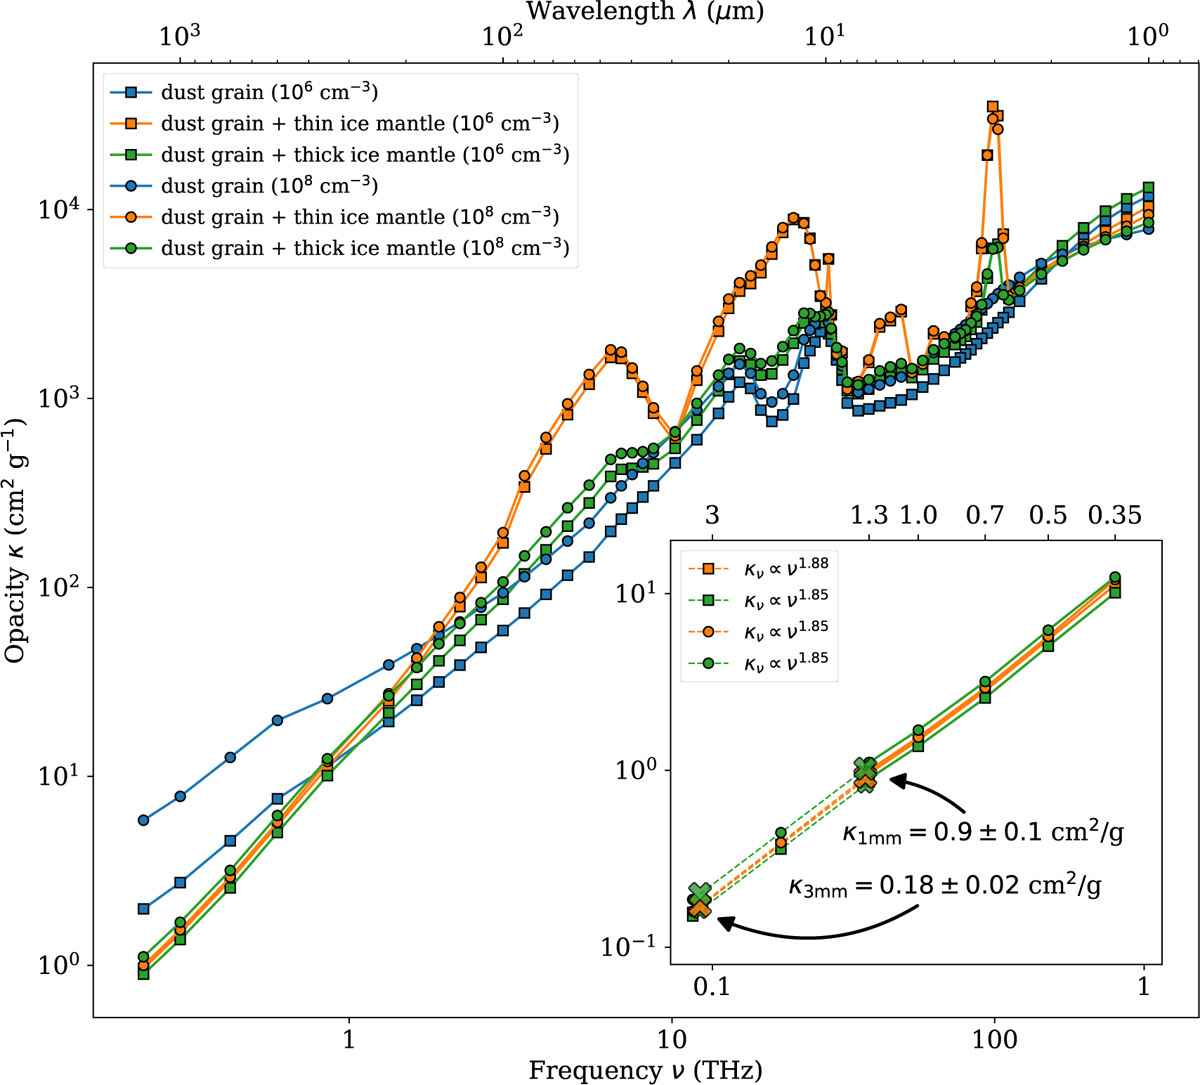
Dust opacity to the 1 and 3 mm from the coagulation model in protostellar cores. The data points in the main panel are retrieved from Ossenkopf & Henning (1994). The blue, orange, and green colors represent the dust grain, dust grain with thin ice mantle, and dust grain with thick ice mantle, respectively. The square and circle line markers represent for the case of volume density of 106 and 108 cm−3, respectively. The subpanel zooms in the frequency range of ∼ 0.1−1 THz, i.e., 300 μm to 3 mm. Based on the retrieved data points in a solid line, dust opacity is extrapolated by a power-law form κν ∝ νβ up to the 3 mm band in a dashed line. The extrapolated dust opacity is κ1 mm = 0.9 ± 0.1 cm2/g and κ3 mm = 0.18 ± 0.02 cm2/g.
Current usage metrics show cumulative count of Article Views (full-text article views including HTML views, PDF and ePub downloads, according to the available data) and Abstracts Views on Vision4Press platform.
Data correspond to usage on the plateform after 2015. The current usage metrics is available 48-96 hours after online publication and is updated daily on week days.
Initial download of the metrics may take a while.